UNITED STATES
SECURITIES AND EXCHANGE COMMISSION
Washington, D.C. 20549
FORM 6-K
REPORT OF FOREIGN PRIVATE ISSUER
PURSUANT TO RULE 13A-16 OR 15D-16
UNDER THE SECURITIES EXCHANGE ACT OF 1934
For the month of May 2025
Commission File Number: 001-41613
Enlight Renewable Energy Ltd.
(Translation of registrant’s name into English)
13 Amal St., Afek Industrial Park
Rosh Ha’ayin, Israel
+ 972 (3) 900-8700
(Address of principal executive office)
Indicate by check mark whether the registrant files or will file annual reports under cover of Form 20-F or Form 40-F.
Form 20-F ☒ Form 40-F ☐
EXPLANATORY NOTE
On May 6, 2025, Enlight Renewable Energy Ltd. (the “Company”) issued a press
release titled: “Enlight Renewable Energy Reports First Quarter 2025 Financial Results” and will conduct a conference call using a presentation titled: “Enlight Earnings Presentation First Quarter 2025.” Details of the conference call are provided in
the press release. A copy of the press release, as well as supplemental appendices containing further information regarding the Company’s financial results for the three-month period ended March 31, 2025, and other operational updates, is furnished
as Exhibit 99.1 herewith and a copy of the presentation is furnished as Exhibit 99.2 herewith.
Incorporation by Reference
Other than as indicated below, the information in this Form 6-K (including in Exhibits 99.1 and 99.2) shall not be
deemed “filed” for purposes of Section 18 of the Securities Exchange Act of 1934, as amended (the “Exchange Act”), or otherwise subject to the liabilities of that section, nor shall it be deemed incorporated by
reference in any filing under the Securities Act of 1933, as amended, or the Exchange Act.
The IFRS financial information contained in the (i) consolidated statements of financial position, (ii) consolidated statements of income and (iii) consolidated statements of
cash flows included in the press release attached as Exhibit 99.1 to this Report on Form 6-K is hereby incorporated by reference into the Company’s Registration Statement on Form S-8 (File No. 333-271297).
EXHIBIT INDEX
The following exhibit is furnished as part of this Form 6-K:
| Exhibit |
Description
|
2
SIGNATURES
Pursuant to the requirements of the Securities Exchange Act of 1934, as amended, the registrant has duly caused this report to be signed on
its behalf by the undersigned, thereunto duly authorized.
|
Enlight Renewable Energy Ltd.
|
||
|
Date: May 6, 2025
|
By
|
/s/ Lisa Haimovitz |
|
Lisa Haimovitz
|
||
|
VP GC
|
||
Exhibit 99.1
|
Press Release
|
 |
ENLIGHT RENEWABLE ENERGY REPORTS
FIRST QUARTER 2025 FINANCIAL RESULTS
All of the amounts disclosed in this press release are in U.S. dollars unless otherwise noted
TEL AVIV, ISRAEL, May 6, 2025 – Enlight Renewable Energy Ltd. (NASDAQ: ENLT, TASE: ENLT) today reported financial
results for the first quarter of 2025 ending March 31, 2025. Registration links for the Company’s earnings English and Hebrew conference call and webcasts can be found at the end of this earnings release.
The entire suite of the Company’s 1Q25 financial results can be found on our IR website at https://enlightenergy.co.il/data/financial-reports/
Financial Highlights
3 months ending March 31, 2025
| • |
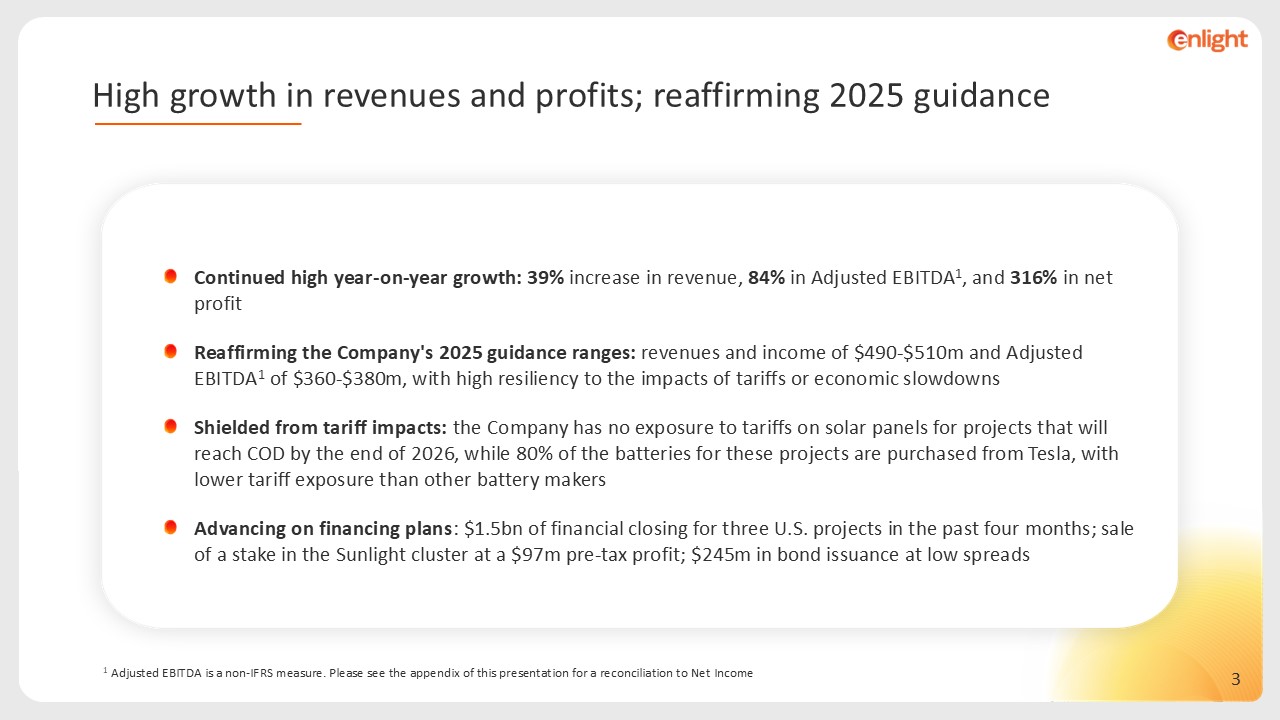
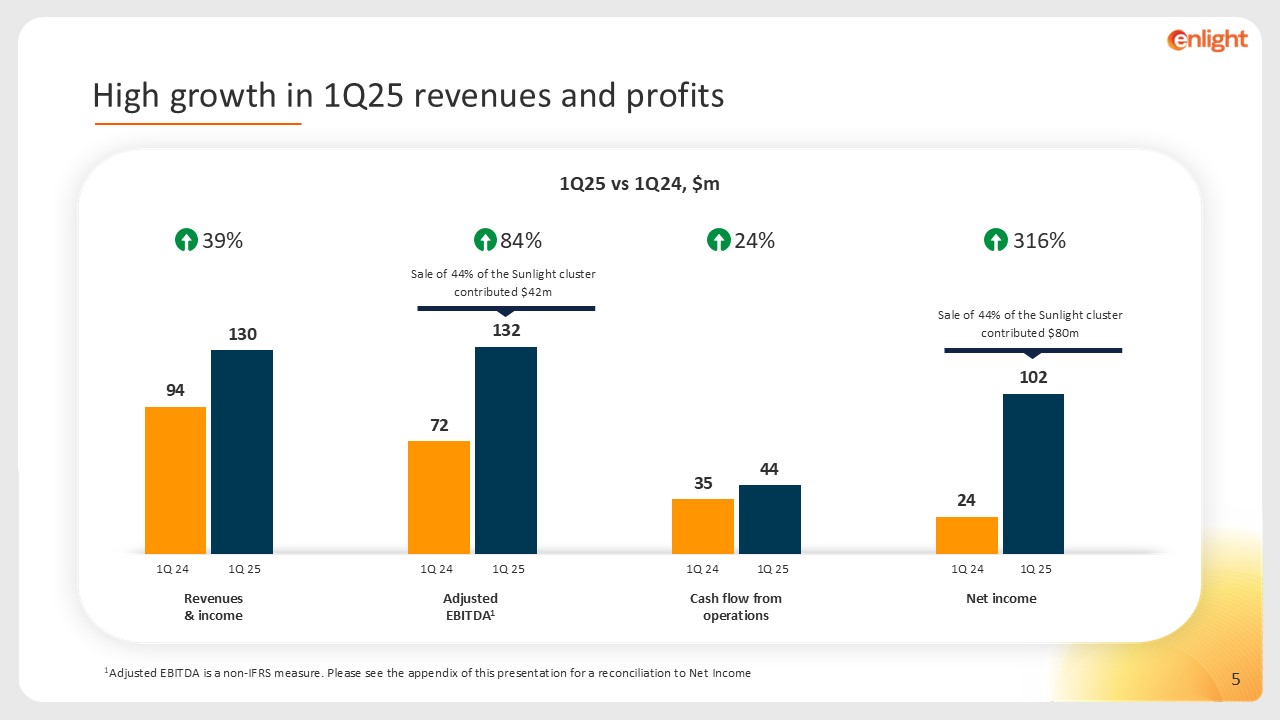
Revenues and income of $130m, up 39% year over year
|
| • |
Adjusted EBITDA1 of $132m, up 84% year over year
|
| • |
Net income of $102m, up 316% year over year
|
| • |
Cash flow from operations of $44m, up 24% year over year
|
|
For the three months ended
|
|||
|
($
millions)
|
31/03/2025
|
31/03/2024
|
% change
|
|
Revenues and Income
|
130
|
94
|
39%
|
|
Net Income
|
102
|
24
|
316%
|
|
Adjusted EBITDA
|
132
|
72
|
84%
|
|
Cash Flow from Operating Activities
|
44
|
35
|
24%
|
| • |
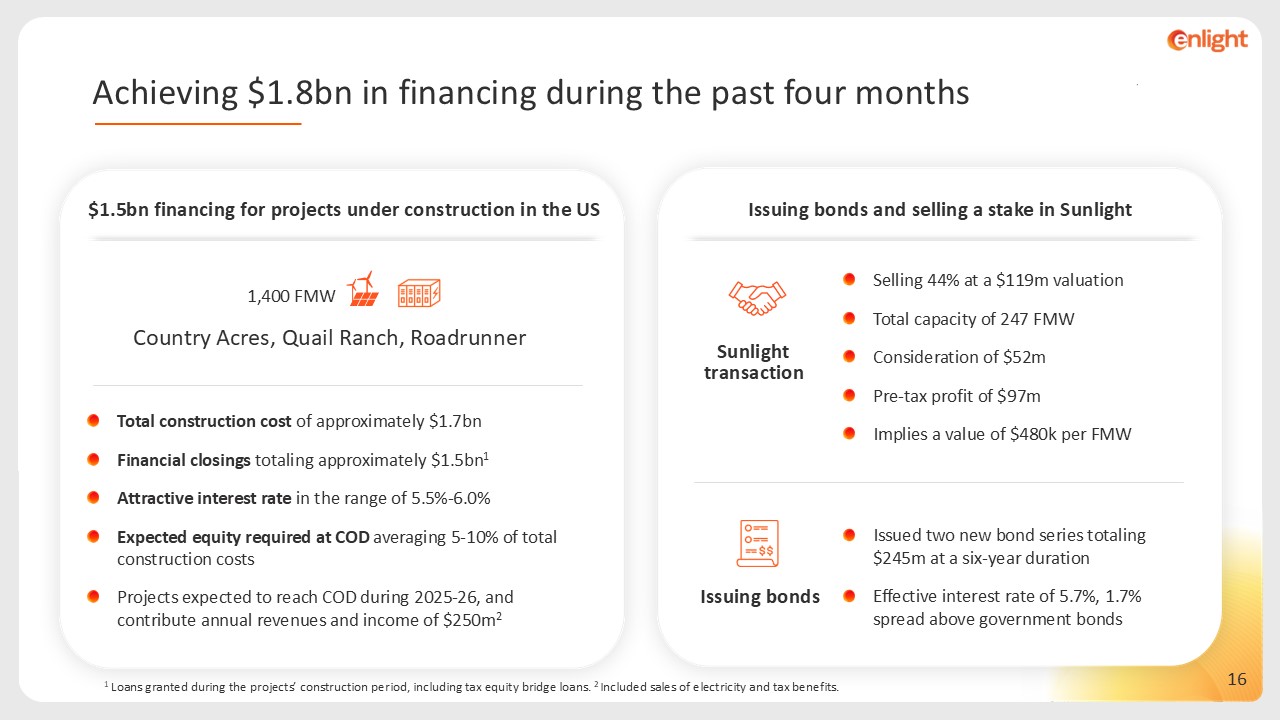
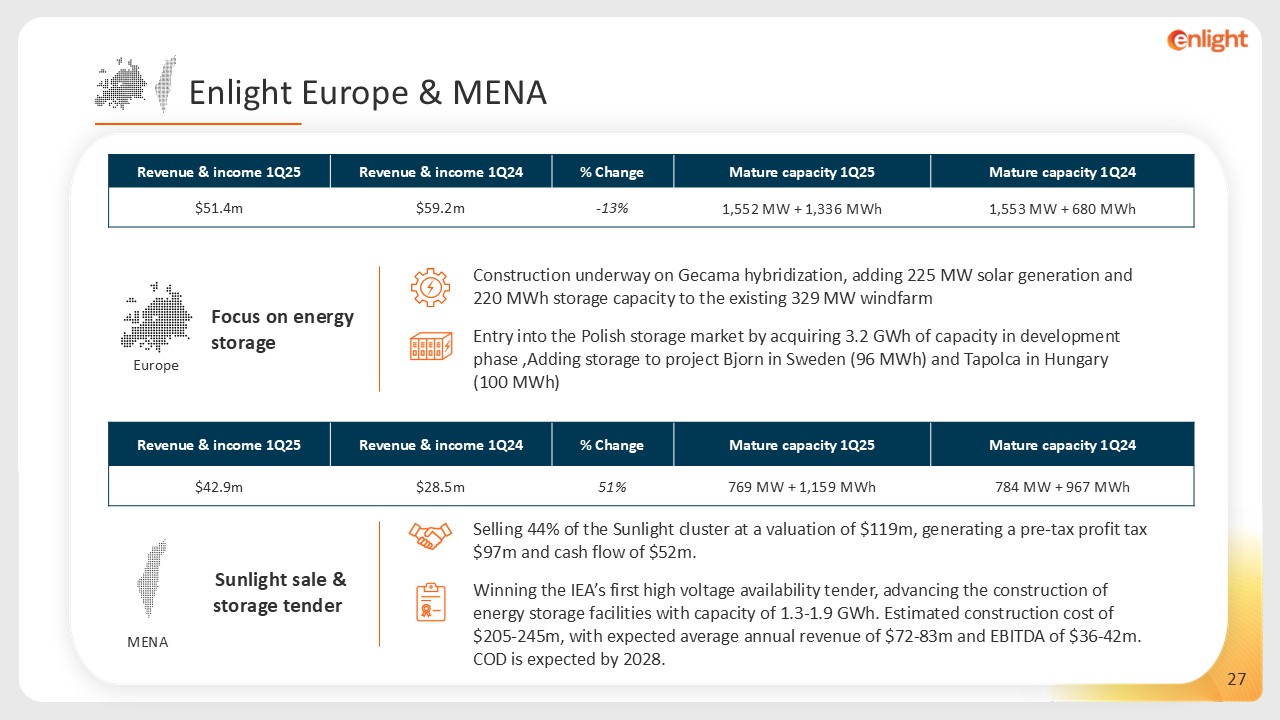
In January 2025, the Company announced the sale of 44% of the Sunlight cluster of renewable energy projects in Israel for a consideration of $52m at a valuation of $119m, and deconsolidated the cluster
from its balance sheet. The transaction added $42m to Adjusted EBITDA (actual consideration received less the book value of the associated assets) and $80m to net profit in the 1Q25 results.
|
| • |
A detailed analysis of financial results appears below
|
1 The Company is unable to provide a reconciliation of Adjusted EBITDA to Net
Income on a forward-looking basis without unreasonable effort because items that impact this IFRS financial measure are not within the Company’s control and/or cannot be reasonably predicted. Please refer to the reconciliation table in Appendix 2
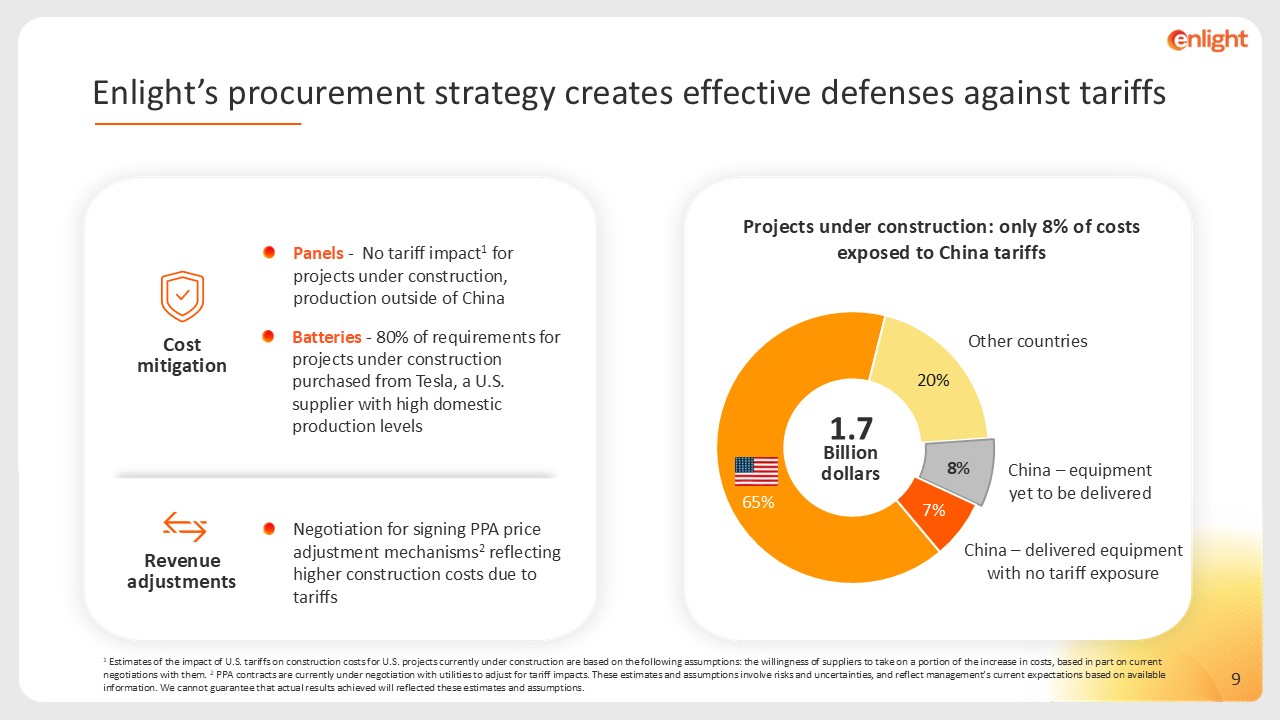
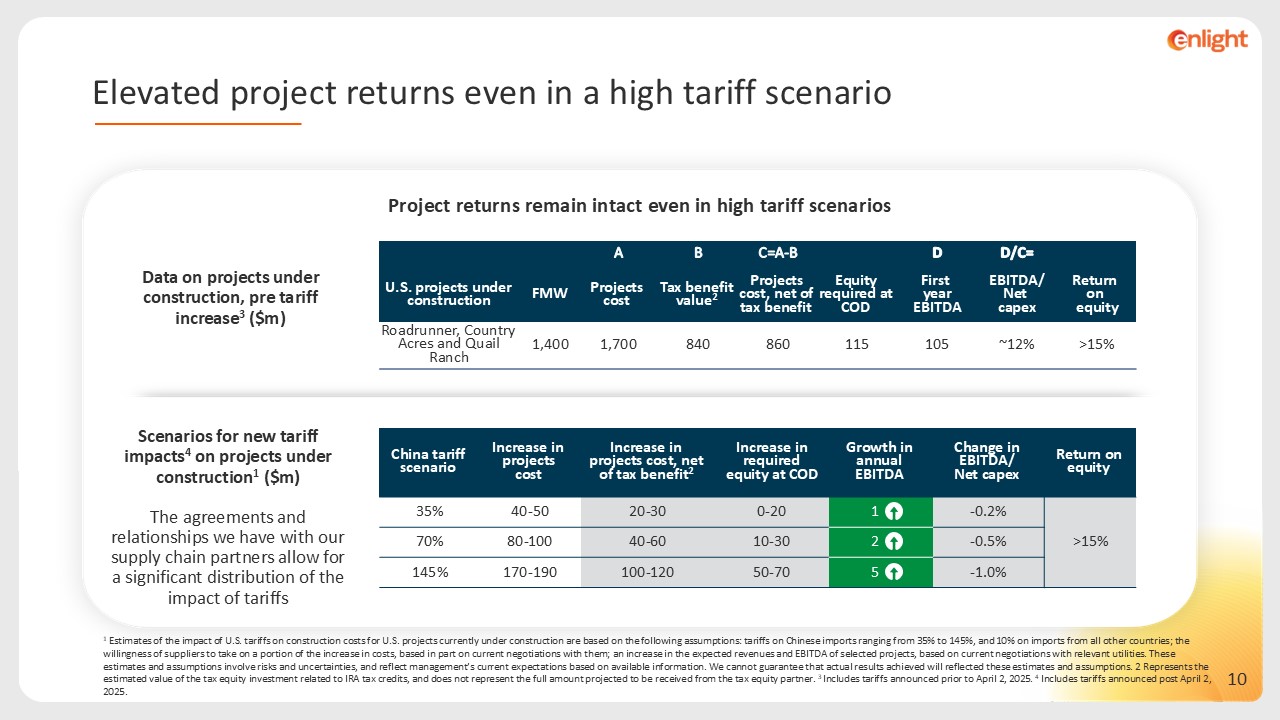
Impact of U.S. Tariffs on the Company’s Operations
Enlight’s procurement strategy has effectively mitigated significant exposure to increased U.S. import tariffs. The agreements and good relationships we
have with our supply chain partners allow for a significant distribution of the impact of tariffs.
Costs
• Solar panels for projects under construction are either domestically constructed or sourced from outside China and carry no tariff exposure
• 80% of battery capacity for projects under construction is supplied by Tesla, a supplier with high levels of domestic U.S. manufacturing
Revenues
• Negotiations for PPA price adjustments are now underway to account for higher tariff-related construction costs
“Enlight showed strong financial results for 1Q25, including 84% growth in Adjusted EBITDA and a 316% rise in net profit,” said Gilad Yavetz, CEO of Enlight Renewable
Energy.
“The introduction of U.S. tariffs underscores how Enlight’s diversified procurement strategy in this market over the past two years has proven itself, effectively shielding
us from cost increases. As a result, our U.S. projects now under construction, with total capex of $1.7bn, have no solar panel exposure under the current tariff policy. Selecting Tesla as our primary storage supplier further strengthens this position
– its substantial levels of U.S. manufacturing offer greater tariff protection than other battery suppliers.
“Securing $1.8bn in financing over recent months marks a significant milestone, and was achieved through three financial closings, a sale of a stake in the Sunlight cluster
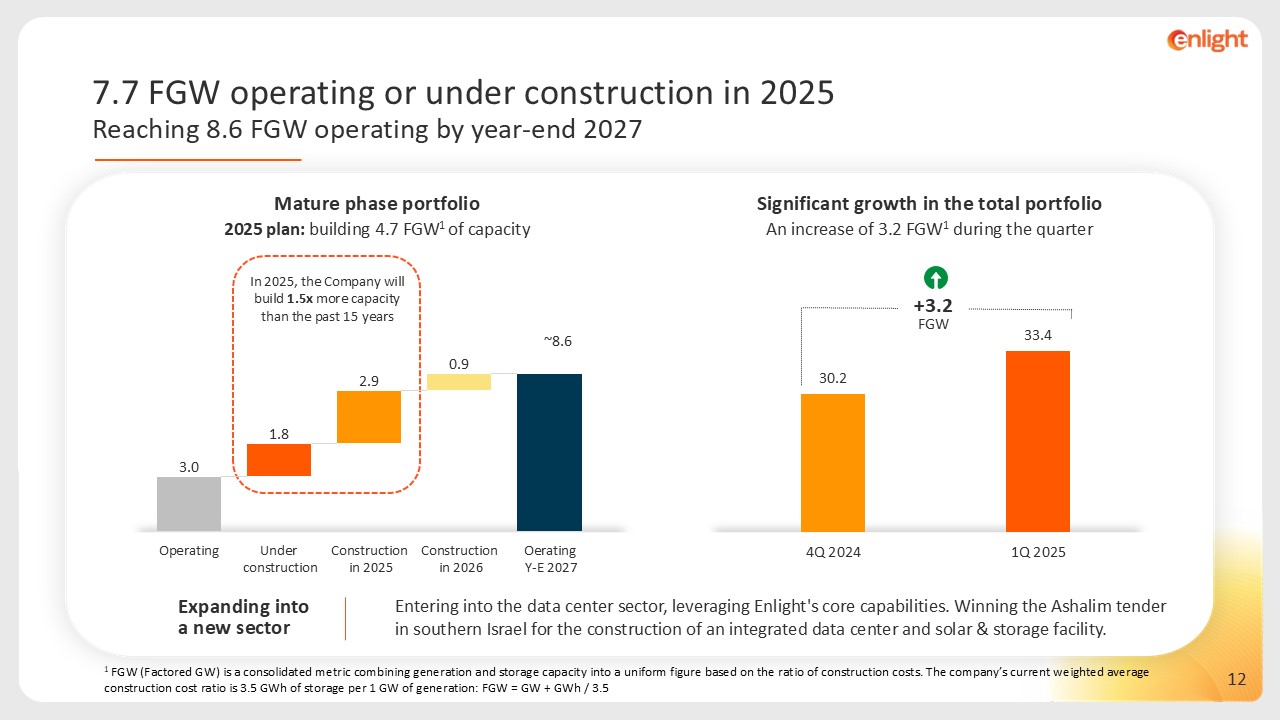
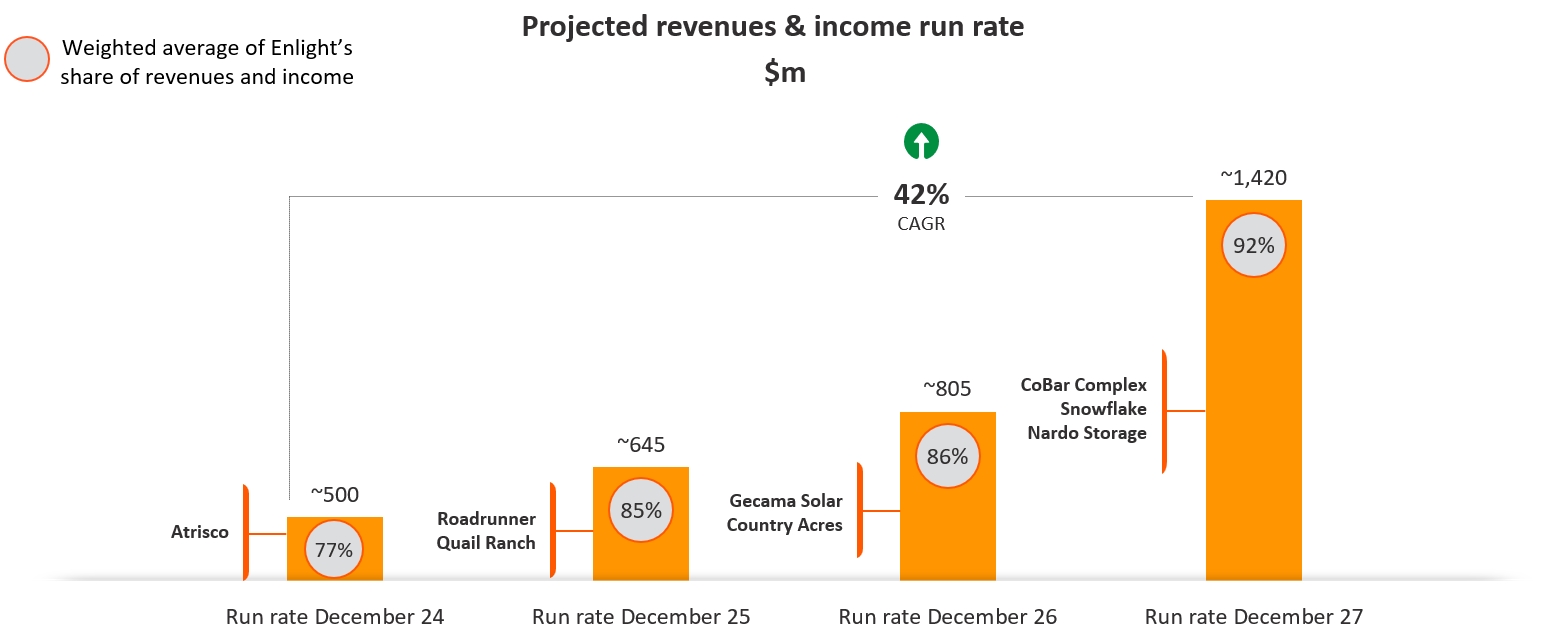
to institutional investors, and a successful bond issuance. This funding will enable the launch of our aggressive plan to begin construction on 4.7 FGW of capacity in 2025. Combined with our existing operating portfolio, these projects represent 90%
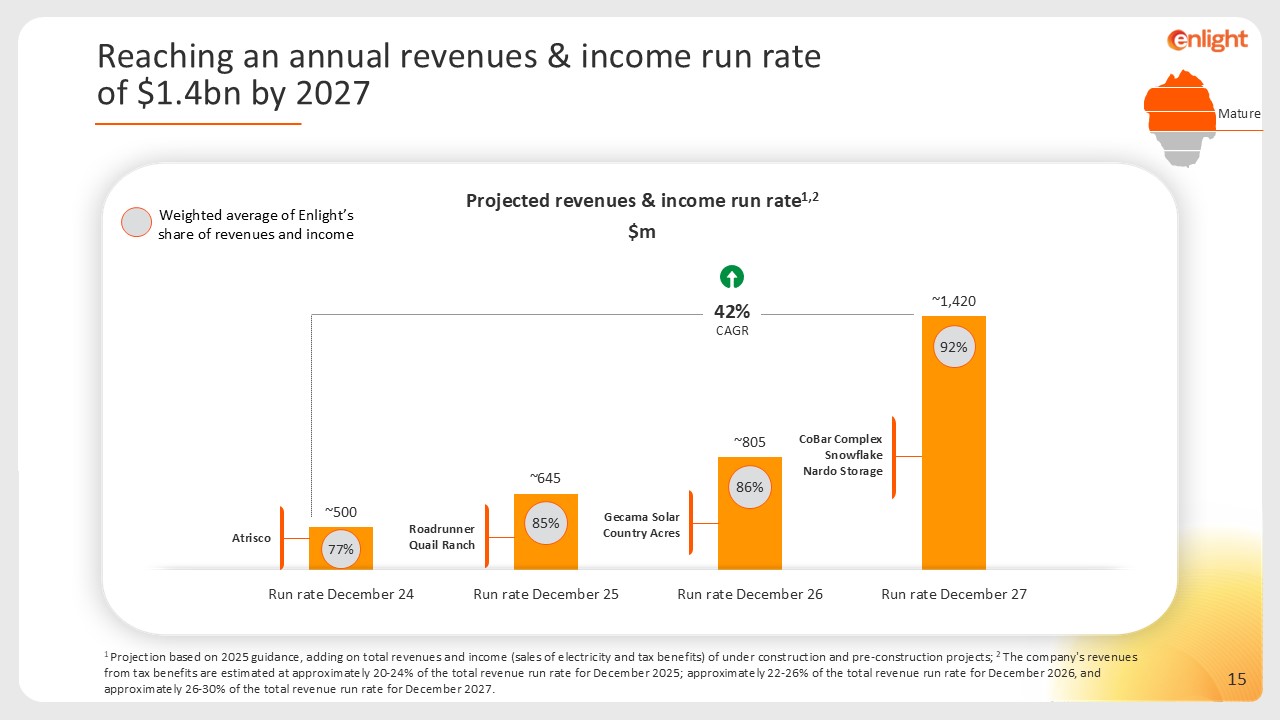
of the capacity required to reach an annual revenue and income run rate of $1.4bn by 2027.”
Portfolio Review
| • |
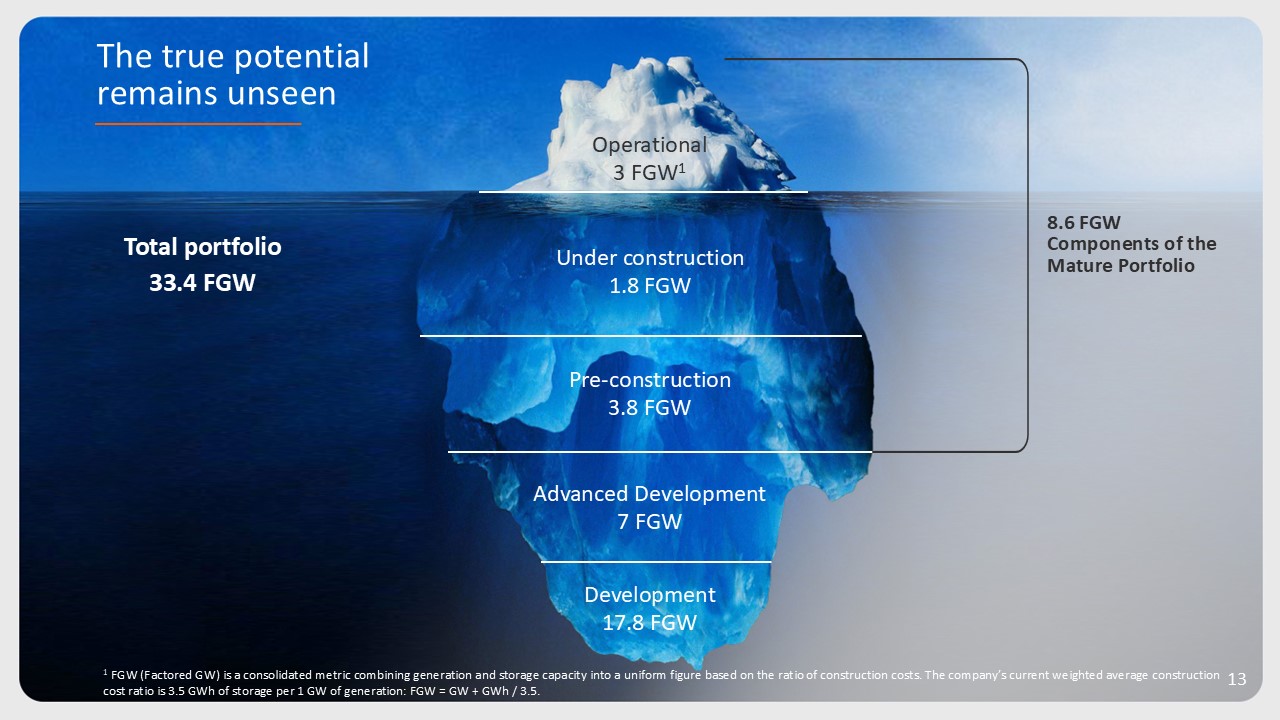
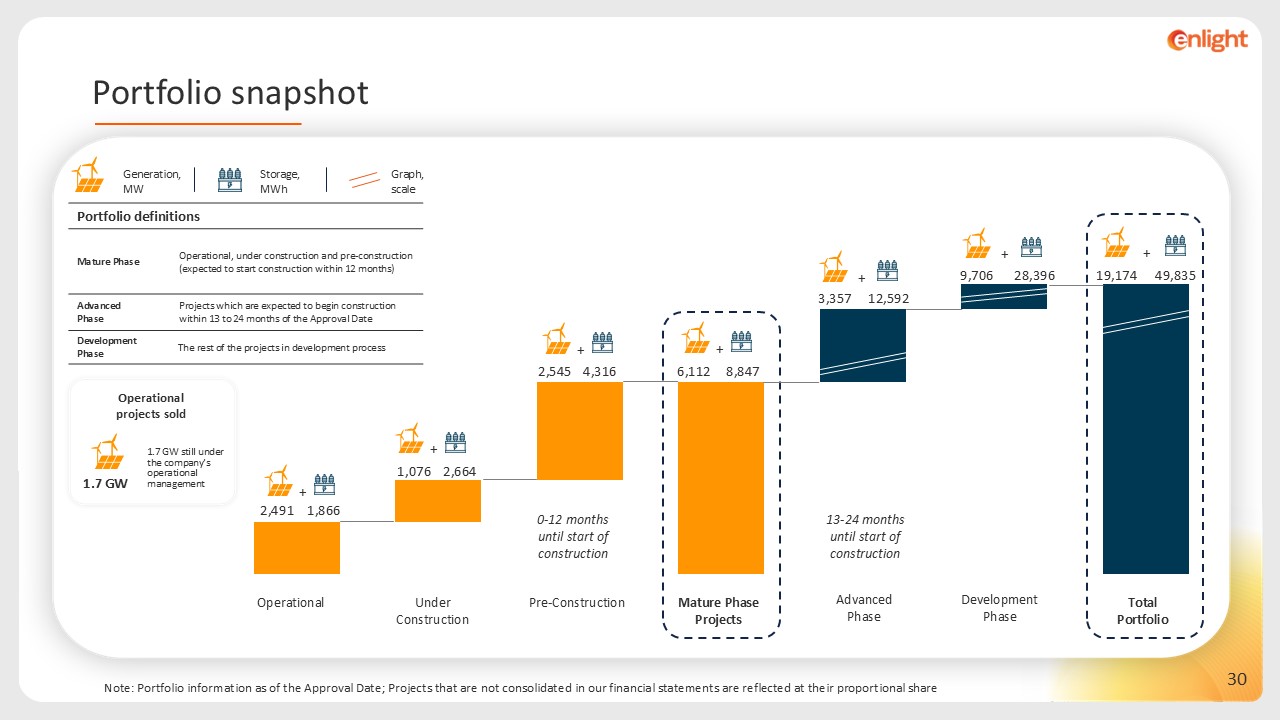
Enlight’s total portfolio is comprised of 19.2 GW of generation capacity and 49.8 GWh storage (33.4 FGW2)
|
| • |
Of this, the Mature portfolio component (including operating projects, projects under construction or pre-construction) contains 6.1 GW generation capacity and 8.8 GWh of storage (8.6 FGW)
|
| • |
Within the Mature portfolio component, the operating component has 2.5 GW of generation capacity and 1.9 GWh of storage (3.0 FGW)
|
The full composition of the portfolio appears in the following table:
|
Component
|
Status
|
FGW2
|
Annual revenues & income run rate ($m)
|
|
Operating
|
Commercial operation
|
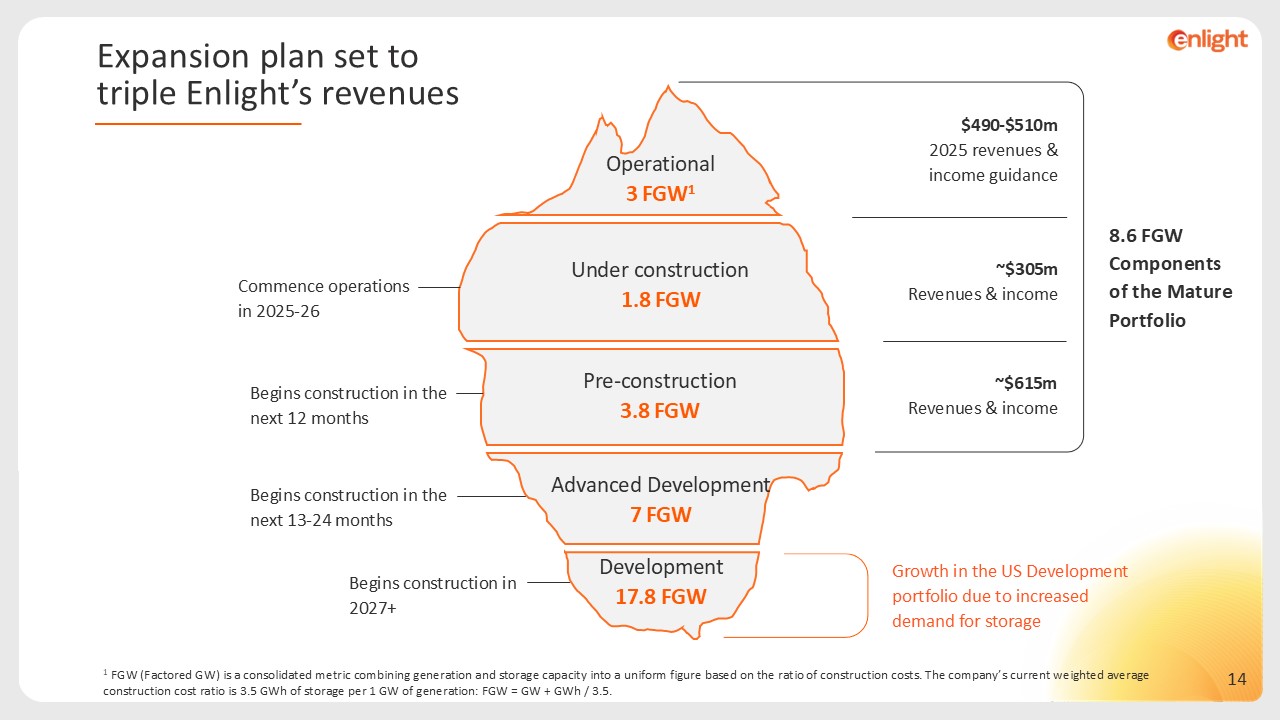
3.0
|
~5003
|
|
Under Construction
|
Under construction
|
1.8
|
~305
|
|
Pre-Construction
|
0-12 months to start of construction
|
3.8
|
~615
|
|
Total Mature Portfolio
|
Mature
|
8.6
|
1,420~
|
|
Advanced Development
|
13-24 months to start of construction
|
7
|
-
|
|
Development
|
2+ years to start of construction
|
17.8
|
-
|
|
Total Portfolio
|
|
33.4
|
-
|
| • |
Operating component of the portfolio: 3 FGW
|
| o |
The operational portfolio totals 3 GW of capacity is spread over three regions: 44% of the capacity is located in 7 European countries, 29% is located in Israel, and 27% in the U.S.
|
| o |
81% of the operational capacity sells electricity under PPA agreements, with 29% of the power sold under inflation-linked PPAs.
|
| o |
The operational portfolio generates annualized revenues and income of approximately $500 million.
|
2 FGW (Factored GW) is a consolidated metric combining generation and storage capacity into a uniform figure based on the ratio of construction costs. The company’s current
weighted average construction cost ratio is 3.5 GWh of storage per 1 GW of generation: FGW = GW + GWh / 3.5
3 Based on the midpoint of 2025 guidance.
| • |
Under Construction component of the portfolio: 1.8 FGW
|
| o |
Consists of three projects in the U.S. with a total capacity of 1.4 FGW; the Gecama Solar project in Spain with a capacity of 0.3 FGW; the solar and storage cluster in Israel; and the addition of storage
capacity at project Bjornberegt in Sweden. Approximately half of the cluster is expected to reach COD in 2025, with the rest expected to commission in 2026.
|
| o |
Projects under construction are expected to contribute $305m to the annual revenues and income run rate during their first full year of operation
|
| • |
Pre-construction component of the portfolio: 3.8 FGW
|
| o |
Two mega projects in the U.S., Snowflake and CO Bar, with a combined capacity of 2.6 FGW will begin construction in 2025 and are expected to contribute $455m to revenues and income on an annualized basis.
|
| o |
Nardo, a stand alone storage project in Italy with a capacity of 0.25 FGW, is expected to begin construction in 2H25. The Pre-construction portion of the Mature portfolio includes additional projects in
Israel, Hungary, and the US with a combined capacity of 0.9 FGW.
|
| o |
Pre-construction projects are expected to contribute $615m in revenues and income in their first full year of operations.
|
The under construction and pre-construction projects are expected to reach COD by the end of 2027, which is
expected to boost operating capacity to 8.6 FGW and the annualized revenue and income run rate to $1.4bn.
| • |
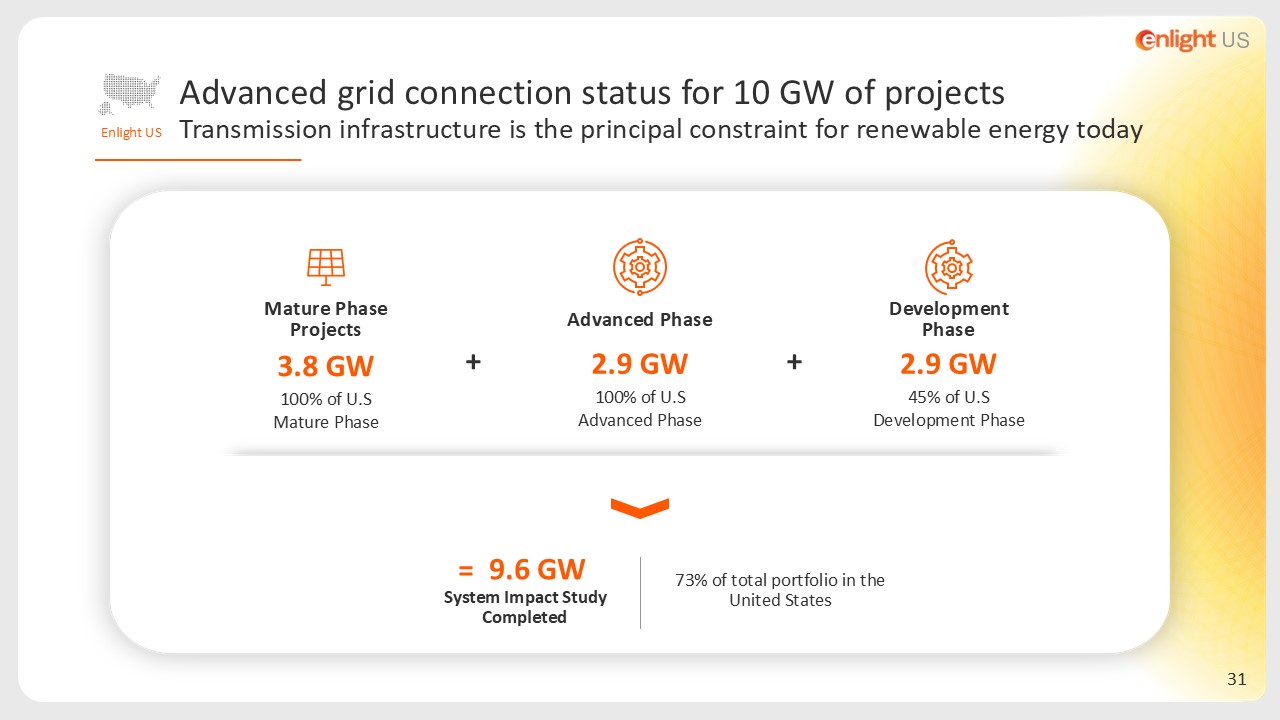
Advanced Development component of the portfolio component: 7 FGW
|
| o |
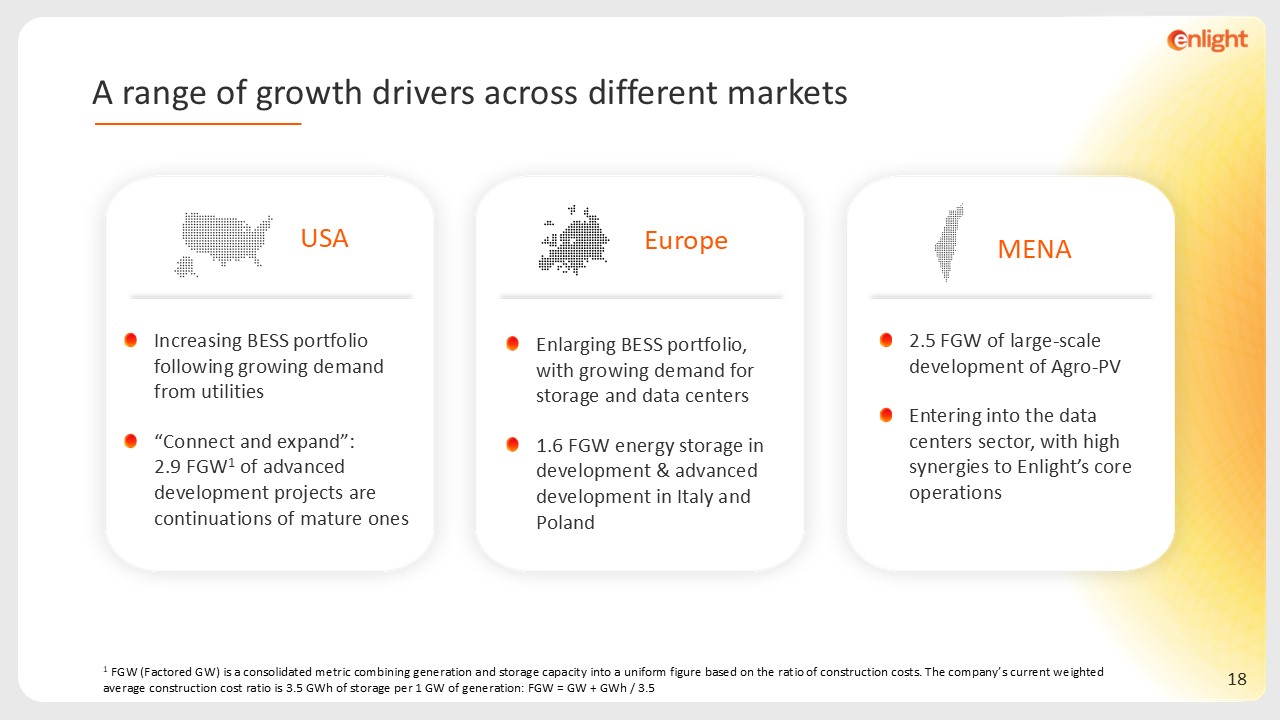
5.7 FGW in the U.S., with 100% of the capacity having passed completion of the System Impact Study, the most important study of the grid connection process, significantly de-risking
the portfolio.
|
| o |
The U.S. pipeline includes several mega-projects, including the 1.4 FGW Cedar Island facility in Oregon and the 1.1 FGW Blackwater project in Virginia.
|
| o |
The U.S. portfolio includes several follow-ons to Mature projects, such as Atrisco 2 (0.7 FGW), the energy storage expansion at CO-Bar (0.9 FGW), and Snowflake B (1.3 FGW).
|
| o |
These projects reflect the Company's “Connect and Expand” strategy, leveraging existing grid infrastructure with the development of new ones, thereby reducing construction costs and
project risks while improving project returns.
|
| o |
0.7 FGW in Europe, focused on Italy, Spain, and Croatia.
|
| o |
0.6 FGW in MENA, focused on solar and storage projects and stand alone storage facilities, including approximately 0.4 FGW that won availability tariffs as part of the Israel
Electricity Authority's first high voltage storage availability tariff tender.
|
| • |
Development component of the portfolio: 17.8 FGW
|
| o |
12 FGW in the U.S. with broad geographic presence, including the PJM, WECC, SPP and MISO regions. The storage portion of the US portfolio has grown by 5.6 FGW to reflect greater demand
for energy storage in this region.
|
| o |
3 FGW in Europe, focused on Italy, Spain, Croatia and entry into stand-alone storage operations in Poland.
|
| o |
2.8 FGW in MENA, focused on solar combined storage projects and stand-alone storage facilities.
|
Mature Portfolio Components Expected to Generate Annualized Revenues and
Income of ~$1.4bn4,5
Financing Activities
| • |
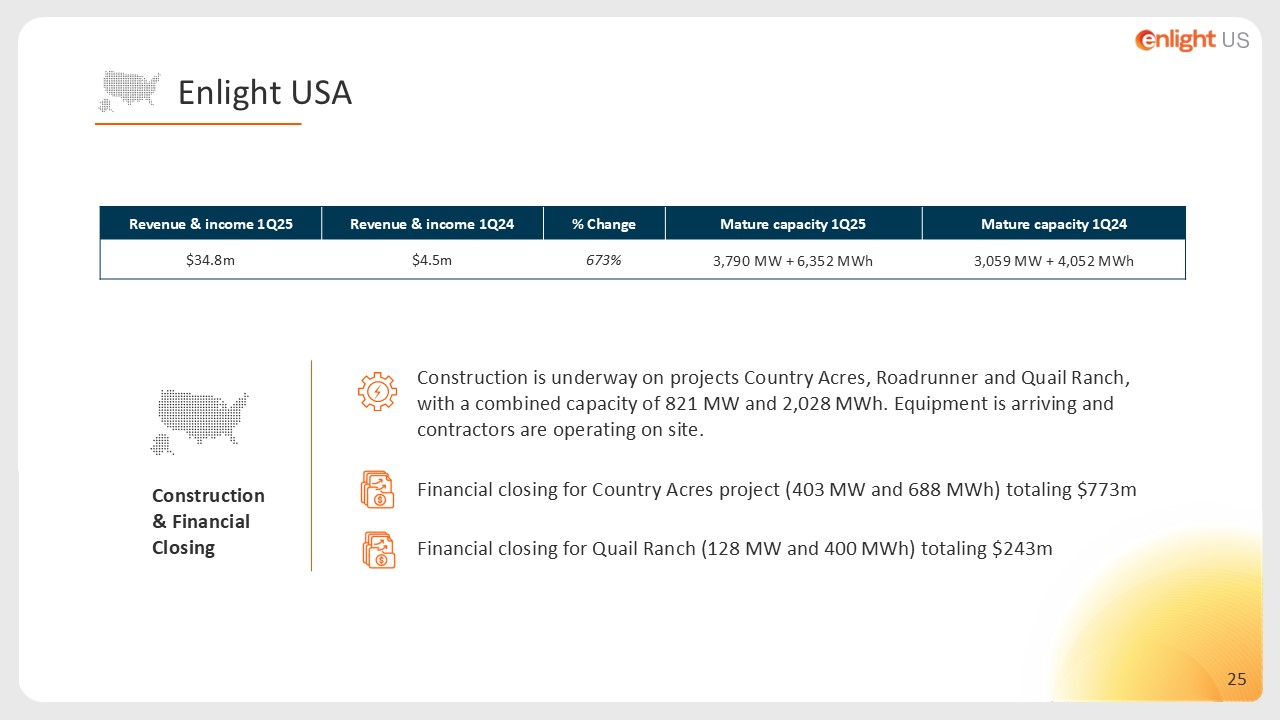
During the quarter, the Company secured $1bn in financial closings for the Country Acres and Quail Ranch projects, representing 830 FMW of combined capacity.
|
| • |
Along with the financial close on the 560 FMW Roadrunner project in December 2024, the financing for the second wave of U.S. projects in now complete, with a total of $1.5bn raised.
|
| • |
Raising $245m through the sale of Series G and H bonds to finance the Company's growth.
|
| • |
Sale of 44% of the Sunlight cluster for $52m cash at a valuation of $119m, generating Adjusted EBITDA of $42m (actual consideration received less associated book value of assets) and a pre-tax profit of
$97m.
|
| • |
As of the balance sheet date, the Company maintained $350m of revolving credit facilities, of which none have been drawn.
|
2025 Guidance
Construction and commissioning
| • |
Expected commissioning of 0.9 FGW of capacity, which is expected to add approximately $148-152m to annualized revenues and income and $129-133m annualized EBITDA, starting in 2026.
|
| • |
Starting construction on 2.9 FGW of capacity, which is expected to add approximately $487-495m in annualized revenues and income and approximately $428-436m in annualized EBITDA gradually through 2026-2027.
|
4 Projection based on 2025 guidance, adding on total revenues and income (sales of electricity and tax benefits) of under construction and pre-construction projects
5 The company's revenues from tax benefits are estimated at approximately 20-24% of the total revenue run rate for December 2025; approximately 22-26% of the total revenue
run rate for December 2026, and approximately 26-30% of the total revenue run rate for December 2027
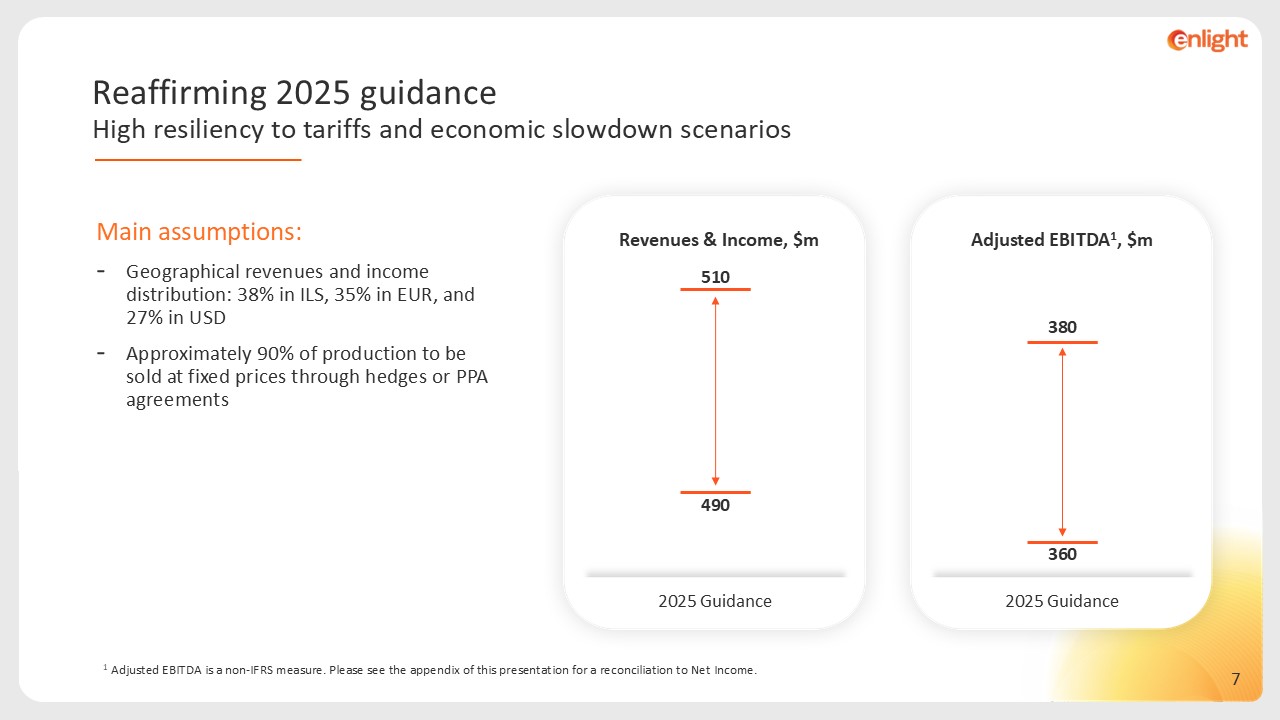
Financial guidance
| • |
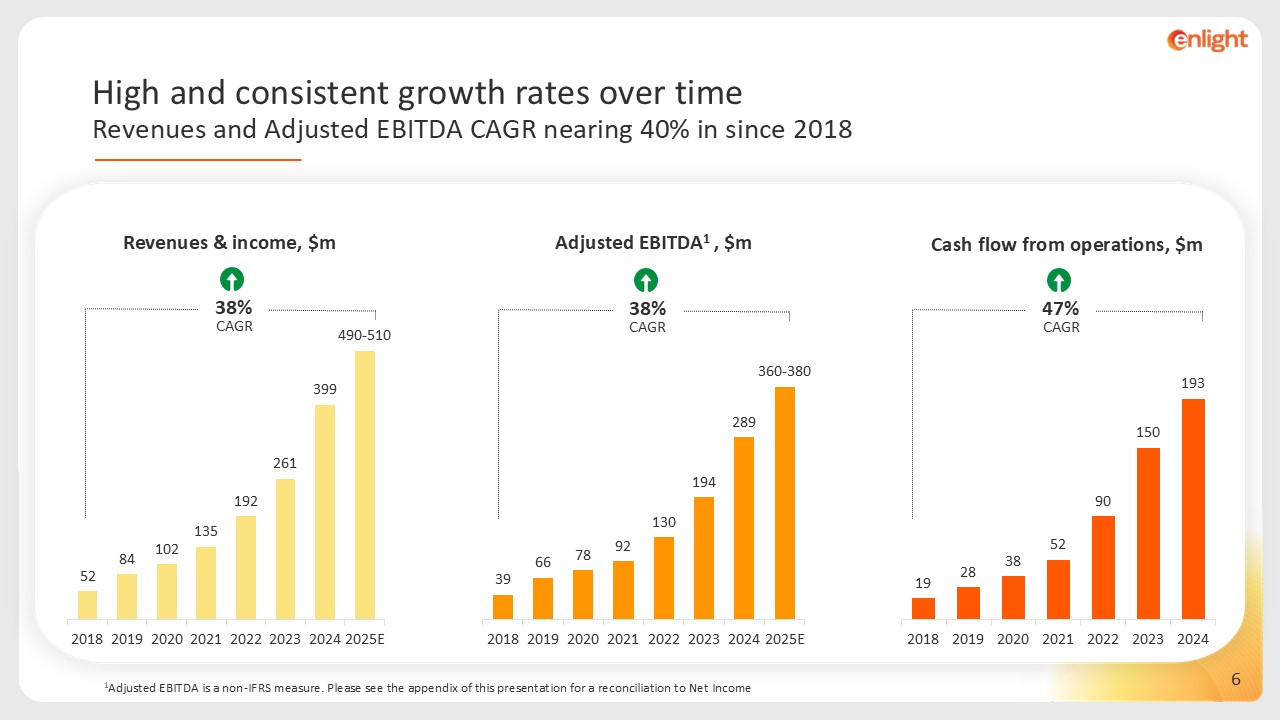
Total revenues and income6 for 2025 are expected to range between $490m and $510m. Of the projected revenues and income, 38% are expected to be denominated in ILS, 35% in EUR, and 27% in USD.
|
| • |
Adjusted EBITDA7 for 2025 is expected to range between $360m and $380m.
|
| • |
Approximately 90% of the electricity volumes expected to be generated in 2025 will be sold at fixed prices through PPAs or hedges.
|
Financial Results Analysis
|
Revenues & Income by Segment
|
|||
| ($ millions) |
For the three months ended |
||
|
Segment
|
31/03/2025
|
31/03/2024
|
% change
|
|
MENA
|
42,867
|
28,474
|
51%
|
|
Europe
|
51,384
|
59,160
|
(13%)
|
|
U.S.
|
34,789
|
4,495
|
674%
|
|
Other
|
829
|
1,532
|
(46%)
|
|
Total Revenues & Income
|
129,869
|
93,661
|
39%
|
Revenues & Income
In the first quarter of 2025, the Company’s total revenues and income increased to $130m, up from $94m last year, a growth rate of 39% year over year. This was composed of
revenues from the sale of electricity, which rose 21% to $110m compared to $90m in the same period of 2024, as well as recognition of $20m in income from tax benefits, up 516% compared to $3m in 1Q24.
The Company benefited from the revenues and income contribution of newly operational projects. Since the first quarter of last year, 576 MW and 1,526 MWh of new projects
were connected to the grid and began selling electricity, including seven of the Israel Solar and Storage Cluster units in Israel, Atrisco in the U.S, Pupin in Serbia, and Tapolca in Hungary. The most important increases in revenue from the sale of
electricity originated at Atrisco, which added $13m, followed by the Israel Solar and Storage Cluster, with $11m, while Pupin contributed $6m. In total, new projects contributed $30m to revenues from the sale of electricity.
Offsetting this growth, the amount of electricity generated at our wind projects operating in Europe was lower compared to the same period last year mainly due to weaker
wind volumes. In addition, generation at project Bjornbeget in Sweden this quarter fell compared to last year due to a blade malfunction experienced at one of the site’s turbines. This prompted a complete shutdown of the wind farm, which is now in
the process of gradually resuming operations. The Company recognized compensation of $4m from Bjornberget’s operating contractor in lieu of the lost revenues, which is recorded in other income.
Revenues and income were distributed between MENA, Europe, and the US, with 34% denominated in Israeli Shekel, 39% in Euros, and 27% denominated in US Dollars.
6 Total revenues and income include revenues from the sale of electricity along with income
from tax benefits from US projects amounting to $60m-80m.
7 EBITDA is a non-IFRS financial measure. The Company is unable to provide a reconciliation of EBITDA to Net Income on a forward-looking basis without unreasonable
effort because items that impact this IFRS financial measure are not within the Company’s control and/or cannot be reasonably predicted. Please refer to the reconciliation table in Appendix 2.
Net Income
In the first quarter of 2025, the Company’s net income amounted to $102m compared to $24m last year, an increase of 316% year over year. This increase stems from the $28m
increase in revenues and income and $80m profit from the partial sale of the Sunlight cluster. This was offset by higher total operating expenses of $17m and net financial expenses of $10m (all after tax).
Adjusted EBITDA8
The Company’s Adjusted EBITDA grew by 84% to $132m in the first quarter of 2025, compared to $72m for the same period in 2024. Of this increase, $36m was driven by the factors described in the
Revenues and Income section. The partial sale of the Sunlight cluster contributed $42m, representing the actual consideration received less the book value of the associated assets. Offsetting this growth was an increase of $11m in COGS linked to the
addition of new projects, and an increase of $4m in operating expenses. Adjusting for the effects of this transaction, 1Q25 Adjusted EBITDA grew by 25% year-on-year to $90m.
8 Adjusted EBITDA is a non-IFRS measure. Please see the appendix of this presentation for a reconciliation to Net Income
Conference Call Information
Enlight plans to hold its First Quarter 2025 Conference Call and Webcasts on Tuesday, May 6, 2025 to review its financial results and business outlook in both English and
Hebrew. Management will deliver prepared remarks followed by a question-and-answer session. Participants can join by dial-in or webcast:
| • |
English Conference Call at 8:00am ET / 3:00pm Israel:
|
Please pre-register to join by conference call using the following link:
https://register-conf.media-server.com/register/BI2f3b7998abd744a590906d1adabe0ad1
Upon registering, you will be emailed a dial-in number, direct passcode and unique PIN.
| • |
English Webcast at 8:00am ET / 3:00pm Israel:
|
Please register and join by webcast at the following link:
https://edge.media-server.com/mmc/p/z2k323sj
| • |
Hebrew Webcast at 5:00am ET / 12:00pm Israel:
|
Please join the webcast at the following link:
https://enlightenergy-co-il.zoom.us/webinar/register/WN_8lhirHEnQLyQju1pvoxZGg
The press release with the financial results as well as the investor presentation materials will be
accessible from the Company’s website prior to the conference call. Approximately one hour after completion of the live call, an archived version of the webcast will be available on the Company’s investor relations website at https://enlightenergy.co.il/info/investors/.
Supplemental Financial and Other Information
We intend to announce material information to the public through the Enlight investor relations website at https://enlightenergy.co.il/info/investors, SEC filings, press releases, public conference calls, and public webcasts. We use these
channels to communicate with our investors, customers, and the public about our company, our offerings, and other issues. As such, we encourage investors, the media, and others to follow the channels listed above, and to review the information
disclosed through such channels. Any updates to the list of disclosure channels through which we will announce information will be posted on the investor relations page of our website.
Non-IFRS Financial Measures
This release presents Adjusted EBITDA, a financial metric, which is provided as a complement to the results provided in accordance with the International Financial Reporting
Standards as issued by the International Accounting Standards Board (“IFRS”). A reconciliation of the non-IFRS financial information to the most directly comparable IFRS financial measure is provided in the accompanying tables found at the end of
this release.
We define Adjusted EBITDA as net income (loss) plus depreciation and amortization, share based compensation, finance expenses, taxes on income and share in losses of equity
accounted investees and minus finance income and non-recurring portions of other income, net. For the purposes of calculating Adjusted EBITDA, compensation for inadequate performance of goods and services procured by the Company are included in other
income, net. Compensation for inadequate performance of goods and services reflects the profits the Company would have generated under regular operating conditions and is therefore included in Adjusted EBITDA. With respect to gains (losses) from
asset disposals, as part of Enlight’s strategy to accelerate growth and reduce the need for equity financing, the Company sells parts of or the entirety of selected renewable project assets from time to time, and therefore includes realized gains or
losses from these asset disposals in Adjusted EBITDA. In the case of partial assets disposals, Adjusted EBITDA includes only the actual consideration less the book value of the assets sold. Our management believes Adjusted EBITDA is indicative of
operational performance and ongoing profitability and uses Adjusted EBITDA to evaluate the operating performance and for planning and forecasting purposes.
Non-IFRS financial measures have limitations as analytical tools and should not be considered in isolation or as substitutes for financial information presented under IFRS.
There are a number of limitations related to the use of non-IFRS financial measures versus comparable financial measures determined under IFRS. For example, other companies in our industry may calculate the non-IFRS financial measures that we use
differently or may use other measures to evaluate their performance. All of these limitations could reduce the usefulness of our non-IFRS financial measures as analytical tools. Investors are encouraged to review the related IFRS financial measure,
Net Income, and the reconciliations of Adjusted EBITDA provided below to Net Income and to not rely on any single financial measure to evaluate our business.
Special Note Regarding Forward-Looking Statements
This press release contains forward-looking statements within the meaning of the U.S. Private Securities Litigation Reform Act of 1995. We intend such forward-looking
statements to be covered by the safe harbor provisions for forward-looking statements as contained in Section 27A of the Securities Act of 1933, as amended, and Section 21E of the Securities Exchange Act of 1934, as amended. All statements contained
in this press release other than statements of historical fact, including, without limitation, statements regarding the Company’s business strategy and plans, capabilities of the Company’s project portfolio and achievement of operational objectives,
market opportunity, utility demand and potential growth, discussions with commercial counterparties and financing sources, pricing trends for materials, progress of Company projects, including anticipated timing of related approvals and project
completion and anticipated production delays, the Company’s future financial results, expected impact from various regulatory developments and anticipated trade sanctions, expectations regarding wind production, electricity prices and windfall taxes,
and Revenues and Income and Adjusted EBITDA guidance, the expected timing of completion of our ongoing projects, and the Company’s anticipated cash requirements and financing plans , are forward-looking statements. The words “may,” “might,” “will,”
“could,” “would,” “should,” “expect,” “plan,” “anticipate,” “intend,” “target,” “seek,” “believe,” “estimate,” “predict,” “potential,” “continue,” “contemplate,” “possible,” “forecasts,” “aims” or the negative of these terms and similar expressions
are intended to identify forward-looking statements, though not all forward-looking statements use these words or expressions.
These statements are neither promises nor guarantees, but involve known and unknown risks, uncertainties and other important factors that may cause our actual results,
performance or achievements to be materially different from any future results, performance or achievements expressed or implied by the forward-looking statements, including, but not limited to, the following: our ability to site suitable land for,
and otherwise source, renewable energy projects and to successfully develop and convert them into Operational Projects; availability of, and access to, interconnection facilities and transmission systems; our ability to obtain and maintain
governmental and other regulatory approvals and permits, including environmental approvals and permits; construction delays, operational delays and supply chain disruptions leading to increased cost of materials required for the construction of our
projects, as well as cost overruns and delays related to disputes with contractors; disruptions in trade caused by political, social or economic instability in regions where our components and materials are made; our suppliers’ ability and
willingness to perform both existing and future obligations; competition from traditional and renewable energy companies in developing renewable energy projects; potential slowed demand for renewable energy projects and our ability to enter into new
offtake contracts on acceptable terms and prices as current offtake contracts expire; offtakers’ ability to terminate contracts or seek other remedies resulting from failure of our projects to meet development, operational or performance benchmarks;
exposure to market prices in some of our offtake contracts; various technical and operational challenges leading to unplanned outages, reduced output, interconnection or termination issues; the dependence of our production and revenue on suitable
meteorological and environmental conditions, and our ability to accurately predict such conditions; our ability to enforce warranties provided by our counterparties in the event that our projects do not perform as expected; government curtailment,
energy price caps and other government actions that restrict or reduce the profitability of renewable energy production; electricity price volatility, unusual weather conditions (including the effects of climate change, could adversely affect wind
and solar conditions), catastrophic weather-related or other damage to facilities, unscheduled generation outages, maintenance or repairs, unanticipated changes to availability due to higher demand, shortages, transportation problems or other
developments, environmental incidents, or electric transmission system constraints and the possibility that we may not have adequate insurance to cover losses as a result of such hazards; our dependence on certain operational projects for a
substantial portion of our cash flows; our ability to continue to grow our portfolio of projects through successful acquisitions; changes and advances in technology that impair or eliminate the competitive advantage of our projects or upsets the
expectations underlying investments in our technologies; our ability to effectively anticipate and manage cost inflation, interest rate risk, currency exchange fluctuations and other macroeconomic conditions that impact our business; our ability to
retain and attract key personnel; our ability to manage legal and regulatory compliance and litigation risk across our global corporate structure; our ability to protect our business from, and manage the impact of, cyber-attacks, disruptions and
security incidents, as well as acts of terrorism or war; changes to existing renewable energy industry policies and regulations that present technical, regulatory and economic barriers to renewable energy projects; the reduction, elimination or
expiration of government incentives or benefits for, or regulations mandating the use of, renewable energy; our ability to effectively manage the global expansion of the scale of our business operations; our ability to perform to expectations in our
new line of business involving the construction of PV systems for municipalities in Israel; our ability to effectively manage our supply chain and comply with applicable regulations with respect to international trade relations, the impact of tariffs
on the cost of construction and our ability to mitigate such impact, sanctions, export controls and anti-bribery and anti-corruption laws; our ability to effectively comply with Environmental Health and Safety and other laws and regulations and
receive and maintain all necessary licenses, permits and authorizations; our performance of various obligations under the terms of our indebtedness (and the indebtedness of our subsidiaries that we guarantee) and our ability to continue to secure
project financing on attractive terms for our projects; limitations on our management rights and operational flexibility due to our use of tax equity arrangements; potential claims and disagreements with partners, investors and other counterparties
that could reduce our right to cash flows generated by our projects; our ability to comply with increasingly complex tax laws of various jurisdictions in which we currently operate as well as the tax laws in jurisdictions in which we intend to
operate in the future; the unknown effect of the dual listing of our ordinary shares on the price of our ordinary shares; various risks related to our incorporation and location in Israel, including the ongoing war in Israel, where our headquarters
and some of our wind energy and solar energy projects are located; the costs and requirements of being a public company, including the diversion of management’s attention with respect to such requirements; certain provisions in our Articles of
Association and certain applicable regulations that may delay or prevent a change of control; and other risk factors set forth in the section titled “Risk factors” in our Annual Report on Form 20-F for the fiscal year ended December 31, 2023, filed
with the Securities and Exchange Commission (the “SEC”), as may be updated in our other documents filed with or furnished to the SEC.
These statements reflect management’s current expectations regarding future events and operating performance and speak only as of the date of this press
release. You should not put undue reliance on any forward-looking statements. Although we believe that the expectations reflected in the forward-looking statements are reasonable, we cannot guarantee that future results, levels of activity,
performance and events and circumstances reflected in the forward-looking statements will be achieved or will occur. Except as required by applicable law, we undertake no obligation to update or revise publicly any forward-looking statements, whether
as a result of new information, future events or otherwise, after the date on which the statements are made or to reflect the occurrence of unanticipated events.
About Enlight
Founded in 2008, Enlight develops, finances, constructs, owns, and operates utility-scale renewable energy projects. Enlight operates across the three largest renewable
segments today: solar, wind and energy storage. A global platform, Enlight operates in the United States, Israel and 10 European countries. Enlight has been traded on the Tel Aviv Stock Exchange since 2010 (TASE: ENLT) and completed its U.S. IPO
(Nasdaq: ENLT) in 2023.
Company Contacts
Yonah Weisz
Director IR
investors@enlightenergy.co.il
Erica Mannion or Mike Funari
Sapphire Investor Relations, LLC
+1 617 542 6180
investors@enlightenergy.co.il
Appendix 1 – Financial information
Consolidated Statements of Income
|
For the three months ended at March 31
|
||||||||
|
2025
|
2024(*)
|
|
||||||
|
USD in
|
USD in
|
|||||||
|
Thousands
|
Thousands
|
|||||||
|
Revenues
|
109,758
|
90,397
|
||||||
|
Tax benefits
|
20,111
|
3,264
|
||||||
|
Total revenues and income
|
129,869
|
93,661
|
||||||
|
Cost of sales (**)
|
(26,638
|
)
|
(15,436
|
)
|
||||
|
Depreciation and amortization
|
(33,789
|
)
|
(25,604
|
)
|
||||
|
General and administrative expenses
|
(11,846
|
)
|
(8,859
|
)
|
||||
|
Development expenses
|
(2,564
|
)
|
(2,418
|
)
|
||||
|
Total operating expenses
|
(74,837
|
)
|
(52,317
|
)
|
||||
|
Gains from projects disposals
|
97,262
|
27
|
||||||
|
Other income (expenses), net
|
(1,105
|
)
|
1,517
|
|||||
|
Operating profit
|
151,189
|
42,888
|
||||||
|
Finance income
|
6,695
|
8,065
|
||||||
|
Finance expenses
|
(30,203
|
)
|
(19,493
|
)
|
||||
|
Total finance expenses, net
|
(23,508
|
)
|
(11,428
|
)
|
||||
|
Profit before tax and equity loss
|
127,681
|
31,460
|
||||||
|
Share of losses of equity accounted investees
|
(1,227
|
)
|
(144
|
)
|
||||
|
Profit before income taxes
|
126,454
|
31,316
|
||||||
|
Taxes on income
|
(24,651
|
)
|
(6,831
|
)
|
||||
|
Profit for the period
|
101,803
|
24,485
|
||||||
|
Profit for the period attributed to:
|
||||||||
|
Owners of the Company
|
94,458
|
16,763
|
||||||
|
Non-controlling interests
|
7,345
|
7,722
|
||||||
|
101,803
|
24,485
|
|||||||
|
Earnings per ordinary share (in USD) with a par value of
|
||||||||
|
NIS 0.1, attributable to owners of the parent Company:
|
||||||||
|
Basic earnings per share
|
0.80
|
0.14
|
||||||
|
Diluted earnings per share
|
0.75
|
0.14
|
||||||
|
Weighted average of share capital used in the
|
||||||||
|
calculation of earnings:
|
||||||||
|
Basic per share
|
118,783,541
|
117,963,310
|
||||||
|
Diluted per share
|
125,316,177
|
122,889,909
|
||||||
(*) The Consolidated Statements of Income have been adjusted to present comparable information for the previous period. For additional details
please see Appendix 8.
(**) Excluding depreciation and amortization.
(**) Excluding depreciation and amortization.
|
Consolidated Statements of Financial Position as of
|
|
|
|
|
March 31
|
December 31
|
|||||||
|
2025
|
2024
|
|||||||
|
USD in
|
USD in
|
|||||||
|
Thousands
|
Thousands
|
|||||||
|
Assets
|
||||||||
|
Current assets
|
||||||||
|
Cash and cash equivalents
|
449,530
|
387,427
|
||||||
|
Restricted cash
|
82,692
|
87,539
|
||||||
|
Trade receivables
|
73,125
|
50,692
|
||||||
|
Other receivables
|
71,475
|
99,651
|
||||||
|
Other financial assets
|
405
|
975
|
||||||
|
Assets of disposal groups classified as held for sale
|
-
|
81,661
|
||||||
|
Total current assets
|
677,227
|
707,945
|
||||||
|
Non-current assets
|
||||||||
|
Restricted cash
|
59,964
|
60,802
|
||||||
|
Other long-term receivables
|
62,092
|
61,045
|
||||||
|
Deferred costs in respect of projects
|
392,119
|
357,358
|
||||||
|
Deferred borrowing costs
|
61
|
276
|
||||||
|
Loans to investee entities
|
32,329
|
18,112
|
||||||
|
Investments in equity accounted investees
|
49,303
|
-
|
||||||
|
Fixed assets, net
|
3,961,021
|
3,699,192
|
||||||
|
Intangible assets, net
|
293,035
|
291,442
|
||||||
|
Deferred taxes assets
|
8,023
|
10,744
|
||||||
|
Right-of-use asset, net
|
210,739
|
210,941
|
||||||
|
Financial assets at fair value through profit or loss
|
74,555
|
69,216
|
||||||
|
Other financial assets
|
63,903
|
59,812
|
||||||
|
Total non-current assets
|
5,207,144
|
4,838,940
|
||||||
|
Total assets
|
5,884,371
|
5,546,885
|
||||||
|
Consolidated Statements of Financial Position as of (Cont.)
|
|
March 31
|
December 31
|
|||||||
|
2025
|
2024
|
|||||||
|
USD in
|
USD in
|
|||||||
|
Thousands
|
Thousands
|
|||||||
|
Liabilities and equity
|
||||||||
|
Current liabilities
|
||||||||
|
Credit and current maturities of loans from
banks and other financial institutions
|
207,662
|
212,246
|
||||||
|
Trade payables
|
167,765
|
161,991
|
||||||
|
Other payables
|
101,928
|
107,825
|
||||||
|
Current maturities of debentures
|
23,049
|
44,962
|
||||||
|
Current maturities of lease liability
|
10,192
|
10,240
|
||||||
|
Other financial liabilities
|
5,777
|
8,141
|
||||||
|
Liabilities of disposal groups classified as held for sale
|
-
|
46,635
|
||||||
|
Total current liabilities
|
516,373
|
592,040
|
||||||
|
Non-current liabilities
|
||||||||
|
Debentures
|
549,517
|
433,994
|
||||||
|
Other financial liabilities
|
118,891
|
107,865
|
||||||
|
Convertible debentures
|
232,536
|
133,056
|
||||||
|
Loans from banks and other financial institutions
|
2,024,315
|
1,996,137
|
||||||
|
Loans from non-controlling interests
|
79,081
|
75,598
|
||||||
|
Financial liabilities through profit or loss
|
25,985
|
25,844
|
||||||
|
Deferred taxes liabilities
|
62,310
|
41,792
|
||||||
|
Employee benefits
|
1,092
|
1,215
|
||||||
|
Lease liability
|
209,958
|
211,941
|
||||||
|
Deferred income related to tax equity
|
387,943
|
403,384
|
||||||
|
Asset retirement obligation
|
85,141
|
83,085
|
||||||
|
Total non-current liabilities
|
3,776,769
|
3,513,911
|
||||||
|
Total liabilities
|
4,293,142
|
4,105,951
|
||||||
|
Equity
|
||||||||
|
Ordinary share capital
|
3,323
|
3,308
|
||||||
|
Share premium
|
1,028,528
|
1,028,532
|
||||||
|
Capital reserves
|
49,890
|
25,273
|
||||||
|
Proceeds on account of convertible options
|
25,083
|
15,494
|
||||||
|
Accumulated profit
|
202,377
|
107,919
|
||||||
|
Equity attributable to shareholders of the Company
|
1,309,201
|
1,180,526
|
||||||
|
Non-controlling interests
|
282,028
|
260,408
|
||||||
|
Total equity
|
1,591,229
|
1,440,934
|
||||||
|
Total liabilities and equity
|
5,884,371
|
5,546,885
|
|
Consolidated Statements of Cash Flows
|
|
|
|
For the three months ended
at March 31 |
||||||||
|
2025
|
2024
|
|||||||
|
USD in
|
USD in
|
|||||||
|
Thousands
|
Thousands
|
|||||||
|
Cash flows for operating activities
|
||||||||
|
Profit for the period
|
101,803
|
24,485
|
||||||
|
Income and expenses not associated with cash flows:
|
||||||||
|
Depreciation and amortization
|
33,789
|
25,604
|
||||||
|
Finance expenses, net
|
22,388
|
11,486
|
||||||
|
Share-based compensation
|
1,710
|
3,117
|
||||||
|
Taxes on income
|
24,651
|
6,831
|
||||||
|
Tax benefits
|
(20,111
|
)
|
(3,264
|
)
|
||||
|
Other income (expenses), net
|
1,105
|
(134
|
)
|
|||||
|
Company’s share in losses of investee partnerships
|
1,227
|
144
|
||||||
|
Gains from projects disposals
|
(97,262
|
)
|
(27
|
)
|
||||
|
(32,503
|
)
|
43,757
|
||||||
|
Changes in assets and liabilities items:
|
||||||||
|
Change in other receivables
|
(856
|
)
|
(2,142
|
)
|
||||
|
Change in trade receivables
|
(20,376
|
)
|
(16,909
|
)
|
||||
|
Change in other payables
|
8,604
|
(539
|
)
|
|||||
|
Change in trade payables
|
7,802
|
71
|
||||||
|
(4,826
|
)
|
(19,519
|
)
|
|||||
|
Interest receipts
|
2,512
|
2,928
|
||||||
|
Interest paid
|
(22,298
|
)
|
(15,624
|
)
|
||||
|
Income Tax paid
|
(1,075
|
)
|
(798
|
)
|
||||
|
Net cash from operating activities
|
43,613
|
35,229
|
||||||
|
Cash flows for investing activities
|
||||||||
|
Sale (Acquisition) of consolidated entities, net
|
36,223
|
(1,388
|
)
|
|||||
|
Changes in restricted cash and bank deposits, net
|
8,176
|
(4,988
|
)
|
|||||
|
Purchase, development, and construction in respect of projects
|
(255,862
|
)
|
(199,733
|
)
|
||||
|
Loans provided and Investment in investees
|
(7,430
|
)
|
(11,284
|
)
|
||||
|
Repayments of loans from investees
|
30,815
|
-
|
||||||
|
Payments on account of acquisition of consolidated entity
|
(7,447
|
)
|
(10,851
|
)
|
||||
|
Purchase of financial assets measured at fair value through profit or loss, net
|
(3,040
|
)
|
(8,409
|
)
|
||||
|
Net cash used in investing activities
|
(198,565
|
)
|
(236,653
|
)
|
||||
|
Consolidated Statements of Cash Flows (Cont.)
|
|
|
For the three months ended at March 31
|
||||||||
|
2025
|
2024
|
|||||||
|
USD in
|
USD in
|
|||||||
|
Thousands
|
Thousands
|
|||||||
|
Cash flows from financing activities
|
||||||||
|
Receipt of loans from banks and other financial institutions
|
143,578
|
71,371
|
||||||
|
Repayment of loans from banks and other financial institutions
|
(108,922
|
)
|
(10,448
|
)
|
||||
|
Issuance of debentures
|
125,838
|
-
|
||||||
|
Issuance of convertible debentures
|
114,685
|
-
|
||||||
|
Repayment of debentures
|
(21,994
|
)
|
(1,284
|
)
|
||||
|
Dividends and distributions by subsidiaries to non-controlling interests
|
-
|
(108
|
)
|
|||||
|
Deferred borrowing costs
|
(35,199
|
)
|
(2,682
|
)
|
||||
|
Repayment of loans from non-controlling interests
|
-
|
(955
|
)
|
|||||
|
Increase in holding rights of consolidated entity
|
(1,392
|
)
|
-
|
|||||
|
Exercise of share options
|
11
|
-
|
||||||
|
Repayment of lease liability
|
(4,058
|
)
|
(3,671
|
)
|
||||
|
Proceeds from investment in entities by non-controlling interest
|
7,732
|
152
|
||||||
|
Net cash from financing activities
|
220,279
|
52,375
|
||||||
|
Increase (Decrease) in cash and cash equivalents
|
65,327
|
(149,049
|
)
|
|||||
|
Balance of cash and cash equivalents at beginning of period
|
387,427
|
403,805
|
||||||
|
Effect of exchange rate fluctuations on cash and cash equivalents
|
(3,224
|
)
|
(4,905
|
)
|
||||
|
Cash and cash equivalents at end of period
|
449,530
|
249,851
|
||||||
Information related to Segmental Reporting
|
For the three months ended at March 31, 2025
|
||||||||||||||||||||||||
|
MENA(**)
|
Europe(**)
|
USA
|
Total reportable segments
|
Others
|
Total
|
|||||||||||||||||||
|
USD in thousands
|
||||||||||||||||||||||||
|
Revenues
|
42,867
|
51,384
|
14,678
|
108,929
|
829
|
109,758
|
||||||||||||||||||
|
Tax benefits
|
-
|
-
|
20,111
|
20,111
|
-
|
20,111
|
||||||||||||||||||
|
Total revenues and income
|
42,867
|
51,384
|
34,789
|
129,040
|
829
|
129,869
|
||||||||||||||||||
|
Segment adjusted EBITDA
|
68,017
|
44,663
|
30,549
|
143,229
|
81
|
143,310
|
||||||||||||||||||
|
Reconciliations of unallocated amounts:
|
||||||||||||||||||||||||
|
Headquarter costs (*)
|
(11,701
|
)
|
||||||||||||||||||||||
|
Intersegment profit
|
106
|
|||||||||||||||||||||||
|
Gains from projects disposals
|
54,973
|
|||||||||||||||||||||||
|
Depreciation and amortization and share-based compensation
|
(35,499
|
)
|
||||||||||||||||||||||
|
Operating profit
|
151,189
|
|||||||||||||||||||||||
|
Finance income
|
6,695
|
|||||||||||||||||||||||
|
Finance expenses
|
(30,203
|
)
|
||||||||||||||||||||||
|
Share in the losses of equity accounted investees
|
(1,227
|
)
|
||||||||||||||||||||||
|
Profit before income taxes
|
126,454
|
|||||||||||||||||||||||
| (*) |
Including general and administrative and development expenses (excluding depreciation and amortization and share based compensation).
|
| (**) |
Due to the Company's organizational restructuring, the Chief Operation Decision Maker (CODM) now reviews the group’s results by segmenting them into three business units: MENA (Middle East and North
Africa), Europe, and the US. Consequently, the Central/Eastern Europe and Western Europe segments have been consolidated into the "Europe" segment, the Israel segment has been incorporated into the MENA segment, and the Management and
Construction segment has been excluded. The comparative figures for the three months ended March 31, 2024, have been updated accordingly.
|
Information related to Segmental Reporting
|
For the three months ended at March 31, 2024
|
||||||||||||||||||||||||
|
MENA
|
Europe
|
USA
|
Total reportable segments
|
Others
|
Total
|
|||||||||||||||||||
|
USD in thousands
|
||||||||||||||||||||||||
|
Revenues
|
28,474
|
59,160
|
1,231
|
88,865
|
1,532
|
90,397
|
||||||||||||||||||
|
Tax benefits
|
-
|
-
|
3,264
|
3,264
|
-
|
3,264
|
||||||||||||||||||
|
Total revenues and income
|
28,474
|
59,160
|
4,495
|
92,129
|
1,532
|
93,661
|
||||||||||||||||||
|
Segment adjusted EBITDA
|
24,528
|
50,707
|
3,122
|
78,357
|
668
|
79,025
|
||||||||||||||||||
|
Reconciliations of unallocated amounts:
|
||||
|
Headquarter costs (*)
|
(7,606
|
)
|
||
|
Intersegment profit
|
190
|
|||
|
Depreciation and amortization and share-based compensation
|
(28,721
|
)
|
||
|
Operating profit
|
42,888
|
|||
|
Finance income
|
8,065
|
|||
|
Finance expenses
|
(19,493
|
)
|
||
|
Share in the losses of equity accounted investees
|
(144
|
)
|
||
|
Profit before income taxes
|
31,316
|
|||
| (*) |
Including general and administrative and development expenses (excluding depreciation and amortization and share based compensation).
|
|
Appendix 2 - econciliations between Net Income to Adjusted EBITDA
|
|
($ thousands)
|
|
For the three months ended at
|
||
|
|
|
March 31, 2025
|
|
March 31, 2024
|
|
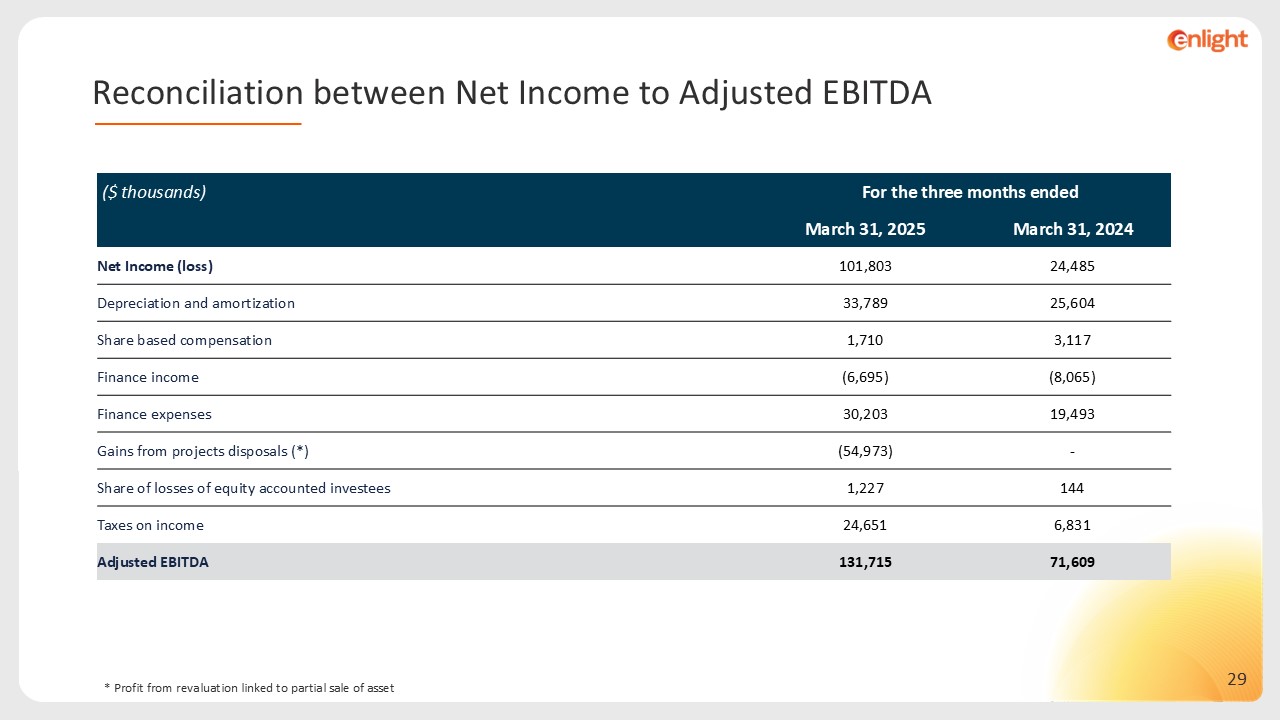
Net Income
|
|
101,803
|
24,485
|
|
|
Depreciation and amortization
|
|
33,789
|
25,604
|
|
|
Share based compensation
|
|
1,710
|
3,117
|
|
|
Finance income
|
|
(6,695)
|
(8,065)
|
|
|
Finance expenses
|
|
30,203
|
19,493
|
|
|
Gains from projects disposals (*)
|
|
(54,973)
|
-
|
|
|
Share of losses of equity accounted investees
|
|
1,227
|
144
|
|
|
Taxes on income
|
|
24,651
|
6,831
|
|
|
Adjusted EBITDA
|
|
131,715
|
71,609
|
|
* Profit from revaluation linked to partial sale of asset.
|
Appendix 3 – Debentures Covenants
Debentures Covenants
As of March 31, 2025, the Company was in compliance with all of its financial covenants under the indenture for the Series C, D, F, G and H Debentures, based on having
achieved the following in its consolidated financial results:
Minimum equity
The company's equity shall be maintained at no less than NIS 375 million so long as debentures F remain outstanding, NIS 1,250 million so long as debentures C and D remain outstanding, and USD
600 million so long as debentures G and H remain outstanding.
As of March 31, 2025, the company’s equity amounted to NIS 5,916 million (USD 1,591 million).
Net financial debt to net CAP
The ratio of standalone net financial debt to net CAP shall not exceed 70% for two consecutive financial periods so long as debentures F remain outstanding and shall not exceed 65% for two
consecutive financial periods so long as debentures C, D, G and H remain outstanding.
As of March 31, 2025, the net financial debt to net CAP ratio, as defined above, stands at 36%.
Net financial debt to EBITDA
So long as debentures F remain outstanding, standalone financial debt shall not exceed NIS 10 million, and the consolidated financial debt to EBITDA ratio shall not exceed 18 for more than two
consecutive financial periods.
For as long as debentures C and D remain outstanding, the consolidated financial debt to EBITDA ratio shall not exceed 15 for more than two consecutive financial periods.
For as long as debentures G and H remain outstanding, the consolidated financial debt to EBITDA ratio shall not exceed 17 for more than two consecutive financial periods.
As of March 31, 2025, the net financial debt to EBITDA ratio, as defined above, stands at 8.
Equity to balance sheet
The standalone equity to total balance sheet ratio shall be maintained at no less than 20% ,25% and 28%, respectively, for two consecutive financial periods for as long as debentures F,
debentures C and D and debentures G and H remain outstanding.
As of March 31, 2025, the equity to balance sheet ratio, as defined above, stands at 55%.
Appendix 4 a) Segment information: Operational projects
|
($ thousands)
|
3 Months ended March 31
|
|||||||
|
Operational Project Segments
|
Installed Capacity (MW)
|
Installed Storage (MWh)
|
Generation
(GWh) |
Revenues and
income
|
Segment Adjusted
EBITDA* |
|||
|
2025
|
2024
|
2025
|
2024
|
2025
|
2024
|
|||
|
MENA
|
652
|
625
|
317
|
251
|
42,867
|
28,474
|
25,750
|
24,528
|
|
Europe
|
1,327
|
-
|
704
|
823
|
51,384
|
59,160
|
44,663
|
50,707
|
|
USA
|
470
|
1,200
|
209
|
26
|
34,789
|
4,494
|
30,549
|
3,121
|
|
Total Consolidated
|
2,449
|
1,825
|
1,230
|
1,100
|
129,040
|
92,128
|
100,962
|
78,356
|
|
Unconsolidated at share
|
42
|
41
|
||||||
|
Total
|
2,491
|
1,866
|
||||||
| b) |
Operational Projects Further Detail
|
|
($ thousands)
|
3 Months ended March 31, 2025
|
||||||
|
Operational Project
|
Segment
|
Installed
Capacity (MW)
|
Installed
Storage
(MWh)
|
Reported Revenue
|
Segment
Adjusted
EBITDA*
|
Debt balance as of
March 31, 2025
|
Ownership %**
|
|
MENA Wind
|
MENA
|
316
|
-
|
22,301
|
|
448,750
|
49%
|
|
MENA PV
|
MENA
|
336
|
625
|
20,566
|
|
486,006
|
76%
|
|
Total MENA
|
652
|
625
|
42,867
|
25,750
|
934,756
|
|
|
|
Europe Wind
|
Europe
|
1,184
|
-
|
48,794
|
|
723,145
|
66%
|
|
Europe PV
|
Europe
|
143
|
-
|
2,590
|
|
68,066
|
76%
|
|
Total Europe
|
|
1,327
|
-
|
51,384
|
44,663
|
791,211
|
|
|
USA PV
|
USA
|
470
|
1,200
|
34,789
|
|
288,790
|
100%
|
|
Total USA
|
470
|
1,200
|
34,789
|
30,549
|
288,790
|
||
|
Total Consolidated Projects
|
2,449
|
1,825
|
129,040
|
100,962
|
2,014,757
|
||
|
Uncons. Projects at share
|
42
|
41
|
50%
|
||||
|
Total
|
2,491
|
1,866
|
129,040
|
100,962
|
2,014,757
|
||
* EBITDA results included $4m in the 3-month ended March 25, of compensation recognized from Björnberget project
** Ownership % is calculated based on the project's share of total revenues
| c) |
Projects under construction
|
|
($ millions)
Consolidated Projects
|
Country
|
Generation and energy storage Capacity (MW/MWh(
|
Est.
COD |
Est. Total
Project Cost** |
Tax credit benefit- Qualifying category
|
Tax credit benefit- Adders*****
|
Discounted Value of Tax Benefit***
|
Est. Total
Project Cost net of tax benefit
|
Capital Invested as of March 31, 2025
|
Est. Equity Required (%)
|
Equity Invested as of March 31, 2025
|
Est. First Full Year Revenue**
|
Est. First Full Year EBITDA**&****
|
Ownership %*
|
|
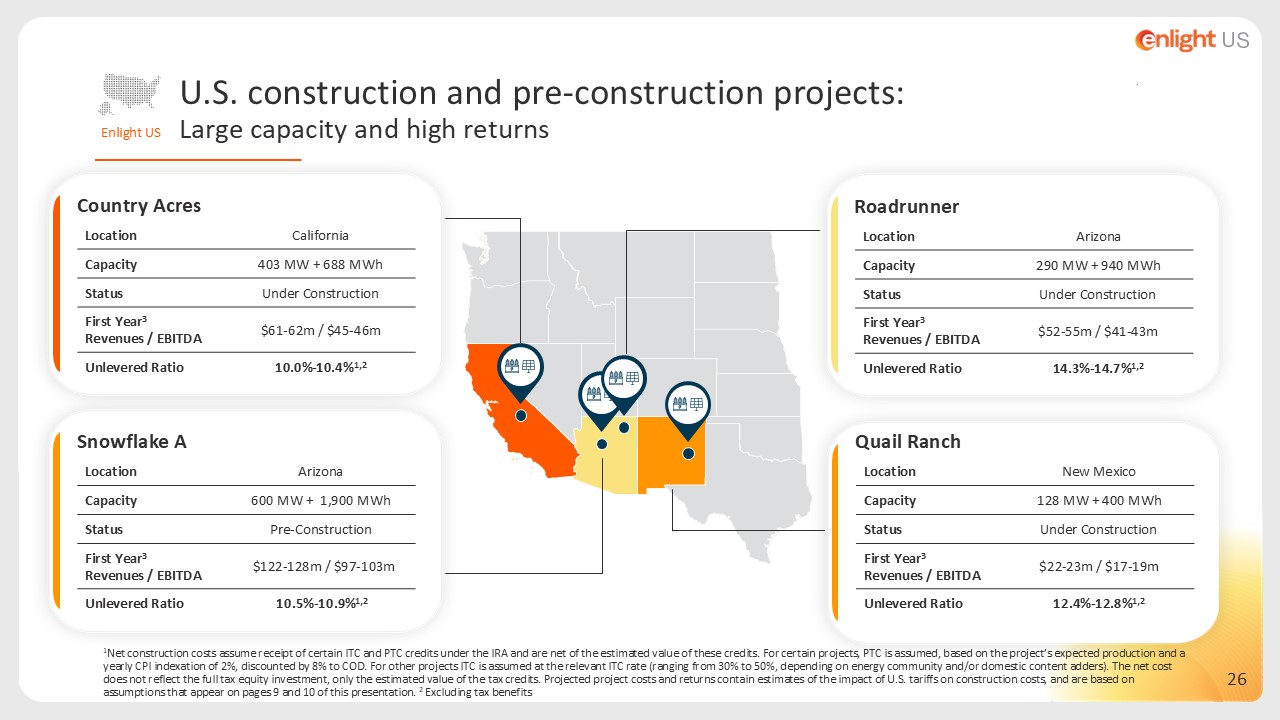
Country Acres
|
USA
|
403/688
|
H2 2026
|
826-864
|
ITC
|
DC (10%)
|
390-405
|
436-459
|
136
|
10%-11%
|
91
|
61-62
|
45-46
|
100%
|
|
Quail Ranch BESS
|
USA
|
0/400
|
H2 2025
|
123-150
|
ITC
|
EC (10%)
|
60-72
|
63-78
|
85
|
12%-15%
|
85
|
22-23
|
17-19
|
100%
|
|
Quail Ranch Solar
|
USA
|
128/0
|
141-148
|
PTC
|
EC (10%)
|
69-73
|
72-75
|
100%
|
||||||
|
Roadrunner BESS
|
USA
|
0/940
|
H2 2025
|
318-341
|
ITC
|
EC (10%)
|
145-155
|
173-186
|
151
|
0%-10%********
|
61
|
52-55
|
41-43
|
100%
|
|
Roadrunner Solar
|
USA
|
290/0
|
284-299
|
PTC
|
EC (10%)
|
167-175
|
117-124
|
100%
|
||||||
|
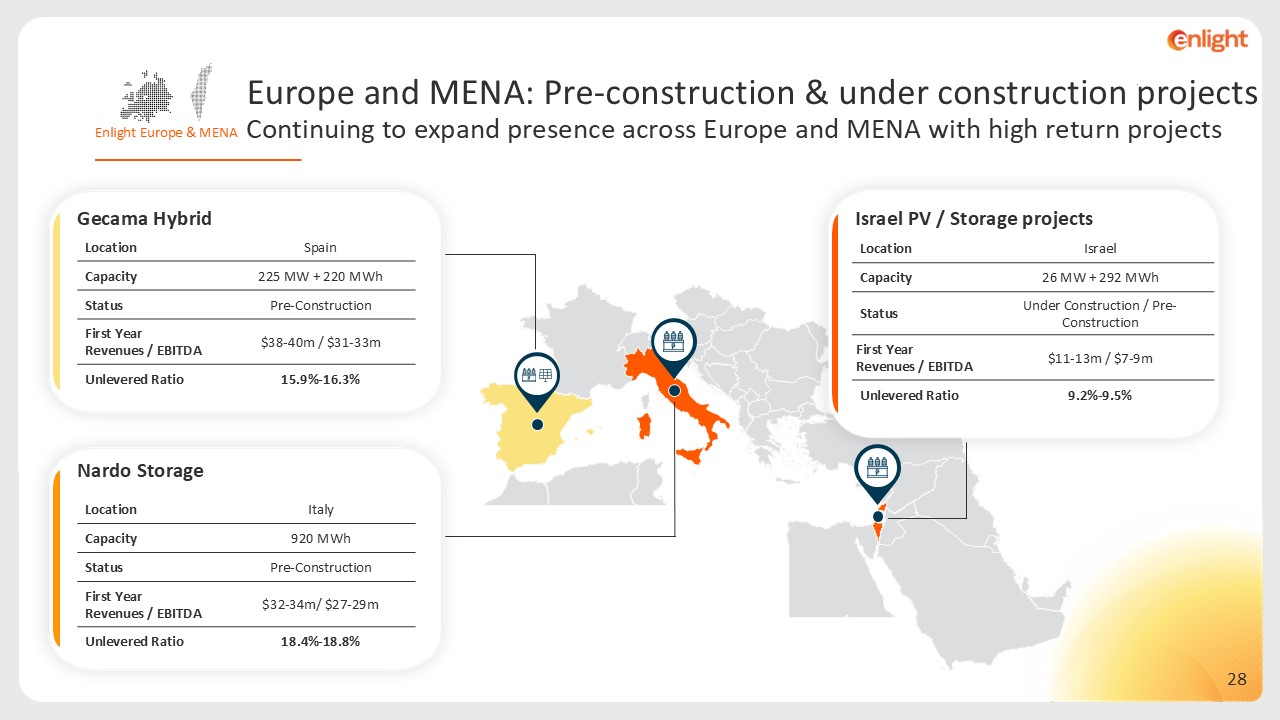
Gecama Solar
|
Spain
|
225/220
|
H1 2026
|
195-205
|
-
|
-
|
-
|
195-205
|
18
|
23%-28%
|
18
|
38-40
|
31-33
|
72%
|
|
Bjornberget – BESS
|
Sweden
|
0/96
|
2026
|
25-27
|
-
|
-
|
-
|
25-27
|
0
|
90%-100%
|
0
|
9-10
|
8
|
55%
|
|
Israel Construction
|
Israel
|
26/241
|
H1 2025-H1 2026
|
67-69
|
-
|
-
|
-
|
67-69
|
37
|
20%-30%
|
37
|
10-11
|
7-8
|
95%
|
|
Total Consolidated Projects
|
|
1,072/
2,585
|
|
1,979-2,103
|
|
|
831-880
|
1,148-1,223
|
427
|
|
292
|
192-201
|
149-157
|
|
|
Unconsolidated Projects at share******
|
Israel
|
4/79
|
H2 2025- H2 2026
|
19-20
|
-
|
-
|
-
|
-
|
6
|
15%-25%
|
6
|
3-4
|
2
|
65%
|
|
Total
|
|
1,076/
2,664
|
|
1,998-2,123
|
|
|
831-880
|
1,148-1,223
|
433
|
|
298
|
195-205
|
151-158
|
d) Pre-Construction Projects (due to commence construction within
12 months of the Approval Date)
|
($ millions)
Consolidated Projects |
Country
|
Generation and energy storage Capacity (MW/MWh)
|
Est.
COD |
Est. Total
Project Cost** |
Tax Credit Benefit
|
Est. Total
Project Cost net of tax benefit |
Capital Invested as of March 31, 2025
|
Est. Equity Required (%)
|
Equity Invested as of March 31, 2025
|
Est. First Full Year Revenue**
|
Est. First Full Year EBITDA**&****
|
Ownership %*
|
||
|
Qualifying Category
|
Adders*****
|
Discounted Value of Tax Benefit***
|
||||||||||||
|
CoBar ITC
|
United States
|
258/824
|
H2 2027
|
606-660
|
ITC
|
EC (10%)
|
267-290
|
339-370
|
40
|
12%-15%
|
40
|
125-128
|
96-101
|
100%
|
|
CoBar PTC
|
United States
|
953/0
|
1,090-1,124
|
PTC
|
EC (10%)
|
558-565
|
532-559
|
|||||||
|
Snowflake A
|
United States
|
600/1,900
|
2027
|
1,475-1,615
|
ITC
|
EC (10%)
|
575-636
|
900-979
|
10
|
10%
|
10
|
122-128
|
97-103
|
100%
|
|
Nardo Storage
|
Italy
|
0/920
|
H2 2027
|
146-154
|
-
|
-
|
-
|
146-154
|
3
|
18%-22%
|
3
|
32-34
|
27-29
|
100%
|
|
($ millions)
Additional Pre-Construction Projects |
MW Deployment
MW/MWh
|
Est. Total
Project Cost** |
Tax Credit Benefit
|
Discounted Value of Tax Benefit***
|
Est. Total
Project Cost net of tax benefit |
Capital Invested as of March 31, 2025
|
Est. Equity Required (%)
|
Equity Invested as of March 31, 2025
|
Est. First Full Year Revenue**
|
Est. First Full Year EBITDA**&****
|
Ownership %*
|
|||
|
2026
|
2027
|
2028
|
Qualifying Category
|
Adders*****
|
||||||||||
|
United States*******
|
-
|
432/400
|
256/0
|
1,213-1,241
|
ITC
|
DC (10%) & EC (10%)
|
498-511
|
715-730
|
44
|
10%-20%
|
44
|
90-92
|
70-71
|
100%
|
|
Europe
|
-
|
0/100
|
-
|
30-31
|
-
|
-
|
-
|
30-31
|
0
|
25%-35%
|
0
|
12
|
8
|
100%
|
|
MENA
|
0/20
|
38/31
|
-
|
88-91
|
-
|
-
|
-
|
88-91
|
10
|
25%-35%
|
10
|
8
|
7
|
84%
|
|
Total Consolidated Projects
|
0/20
|
470/531
|
256/0
|
1,331-1,363
|
498-511
|
833-852
|
54
|
|
54
|
110-112
|
85-86
|
|||
|
Unconsolidated Projects at share
|
8/42
|
0/79
|
-
|
45-46
|
-
|
-
|
-
|
45-46
|
0
|
25%
|
0
|
4
|
3
|
53%
|
|
Total Pre-Construction
|
2,545MW +4,316MWh
|
4,693-4,962
|
1,898-2,002
|
2,795-2,960
|
107
|
|
107
|
393-406
|
308-322
|
|||||
* The legal ownership share for all U.S. projects is 90%, but Enlight invests 100% of the equity in the project and entitled to 100% of the project distributions until full repayment of
Enlight's capital plus a preferred return
** Estimates of the impact of U.S. tariffs on construction costs for U.S. projects currently under construction are based on the following assumptions:
tariffs on Chinese imports ranging 0-70% , and 10% on imports from all other countries; the willingness of suppliers to take on a portion of the increase in costs, based in part on current negotiations with them; an increase in the expected revenues
and EBITDA of selected projects, based on current negotiations with relevant utilities. These estimates and assumptions involve risks and uncertainties and reflect management’s current expectations based on available information. We cannot guarantee
that actual results achieved will reflect these estimates and assumptions.
***Tax benefits under the IRA. PTC is assumed, based on the project’s expected production and a yearly CPI indexation of 2%, discounted by 8% to COD.
For the ITC, a step-up adjustment was made to reflect the eligible higher tax credit rates, enhancing the valuation and return of the project by considering the increased project value.**** EBITDA is a non-IFRS financial measure. This figure
represents consolidated EBITDA for the project and excludes the share of project distributions to tax equity partners, as well as ITC and PTC proceeds. These components of the tax equity transaction may differ from project to project, are subject to
market conditions and commercial terms agreed upon reaching financial close.*****The Energy Community (EC) Adder provides extra credits for renewable energy projects in areas impacted by fossil fuel reliance or economic transition. The Domestic
Content (DC) Adder rewards projects using U.S.-manufactured components, promoting local job creation and supply chain growth
****** All numbers, beside equity invested, reflects Enlight share only *******Including Rustic hills 1+2, Coggon, Gemstone and Crimson orchard******** The required equity during construction is estimated at 10% and is expected to decrease to 0% at COD
Appendix 5 – cash and cash equivalents
|
($ thousands)
|
March 31, 2025
|
|
Cash and Cash Equivalents:
|
|
|
Enlight Renewable Energy Ltd, Enlight EU Energies Kft and Enlight Renewable LLC excluding subsidiaries (“Topco”)
|
181,232
|
|
Subsidiaries
|
268,298
|
|
Deposits:
|
|
|
Short term deposits
|
-
|
|
Restricted Cash:
|
|
|
Projects under construction
|
82,692
|
|
Reserves, including debt service, performance obligations and others
|
59,964
|
|
Total Cash
|
592,186
|
Appendix 6 – Corporate level (TopCo) debt
|
($ thousands)
|
March 31, 2025
|
|
Debentures:
|
|
|
Debentures
|
572,566*
|
|
Convertible debentures
|
232,536
|
|
Loans from banks and other financial institutions:
|
|
|
Credit and short-term loans from banks and other financial institutions
|
-
|
|
Loans from banks and other financial institutions
|
116,364
|
|
Total corporate level debt
|
921,466
|
* Including current maturities of debentures in the amount of 23,049
Appendix 7 – Functional Currency Conversion Rates:
The financial statements of each of the Company’s subsidiaries were prepared in the currency of the main economic environment in which it operates (hereinafter: the
“Functional Currency”). For the purpose of consolidating the financial statements, results and financial position of each of the Group’s member companies are translated into the Israeli shekel (“NIS”), which is the Company’s Functional Currency. The
Group’s consolidated financial statements are presented in U.S. dollars (“USD”).
FX Rates to USD:
|
Date of the financial statements:
|
Euro
|
NIS
|
|
As of 31th March 2025
|
1.08
|
0.27
|
|
As of 31th March 2024
|
1.08
|
0.27
|
Average for the 3 months period ended:
| March 2025 |
1.05
|
0.28
|
| March 2024 |
1.09
|
0.28
|
Appendix 8 – Structural changes to the Consolidated Statements of Income:
The Company has changed its presentation of its Income Statement, which includes the presentation of specified items that have been previously included within other income (i.e. tax equity). In
addition, the Company has decided to remove the Gross Profit line item.
The Company believes that such presentation provides a more relevant information and better reflects the measurement of its financial performance. The Company applied such change
retrospectively.
Exhibit 99.2